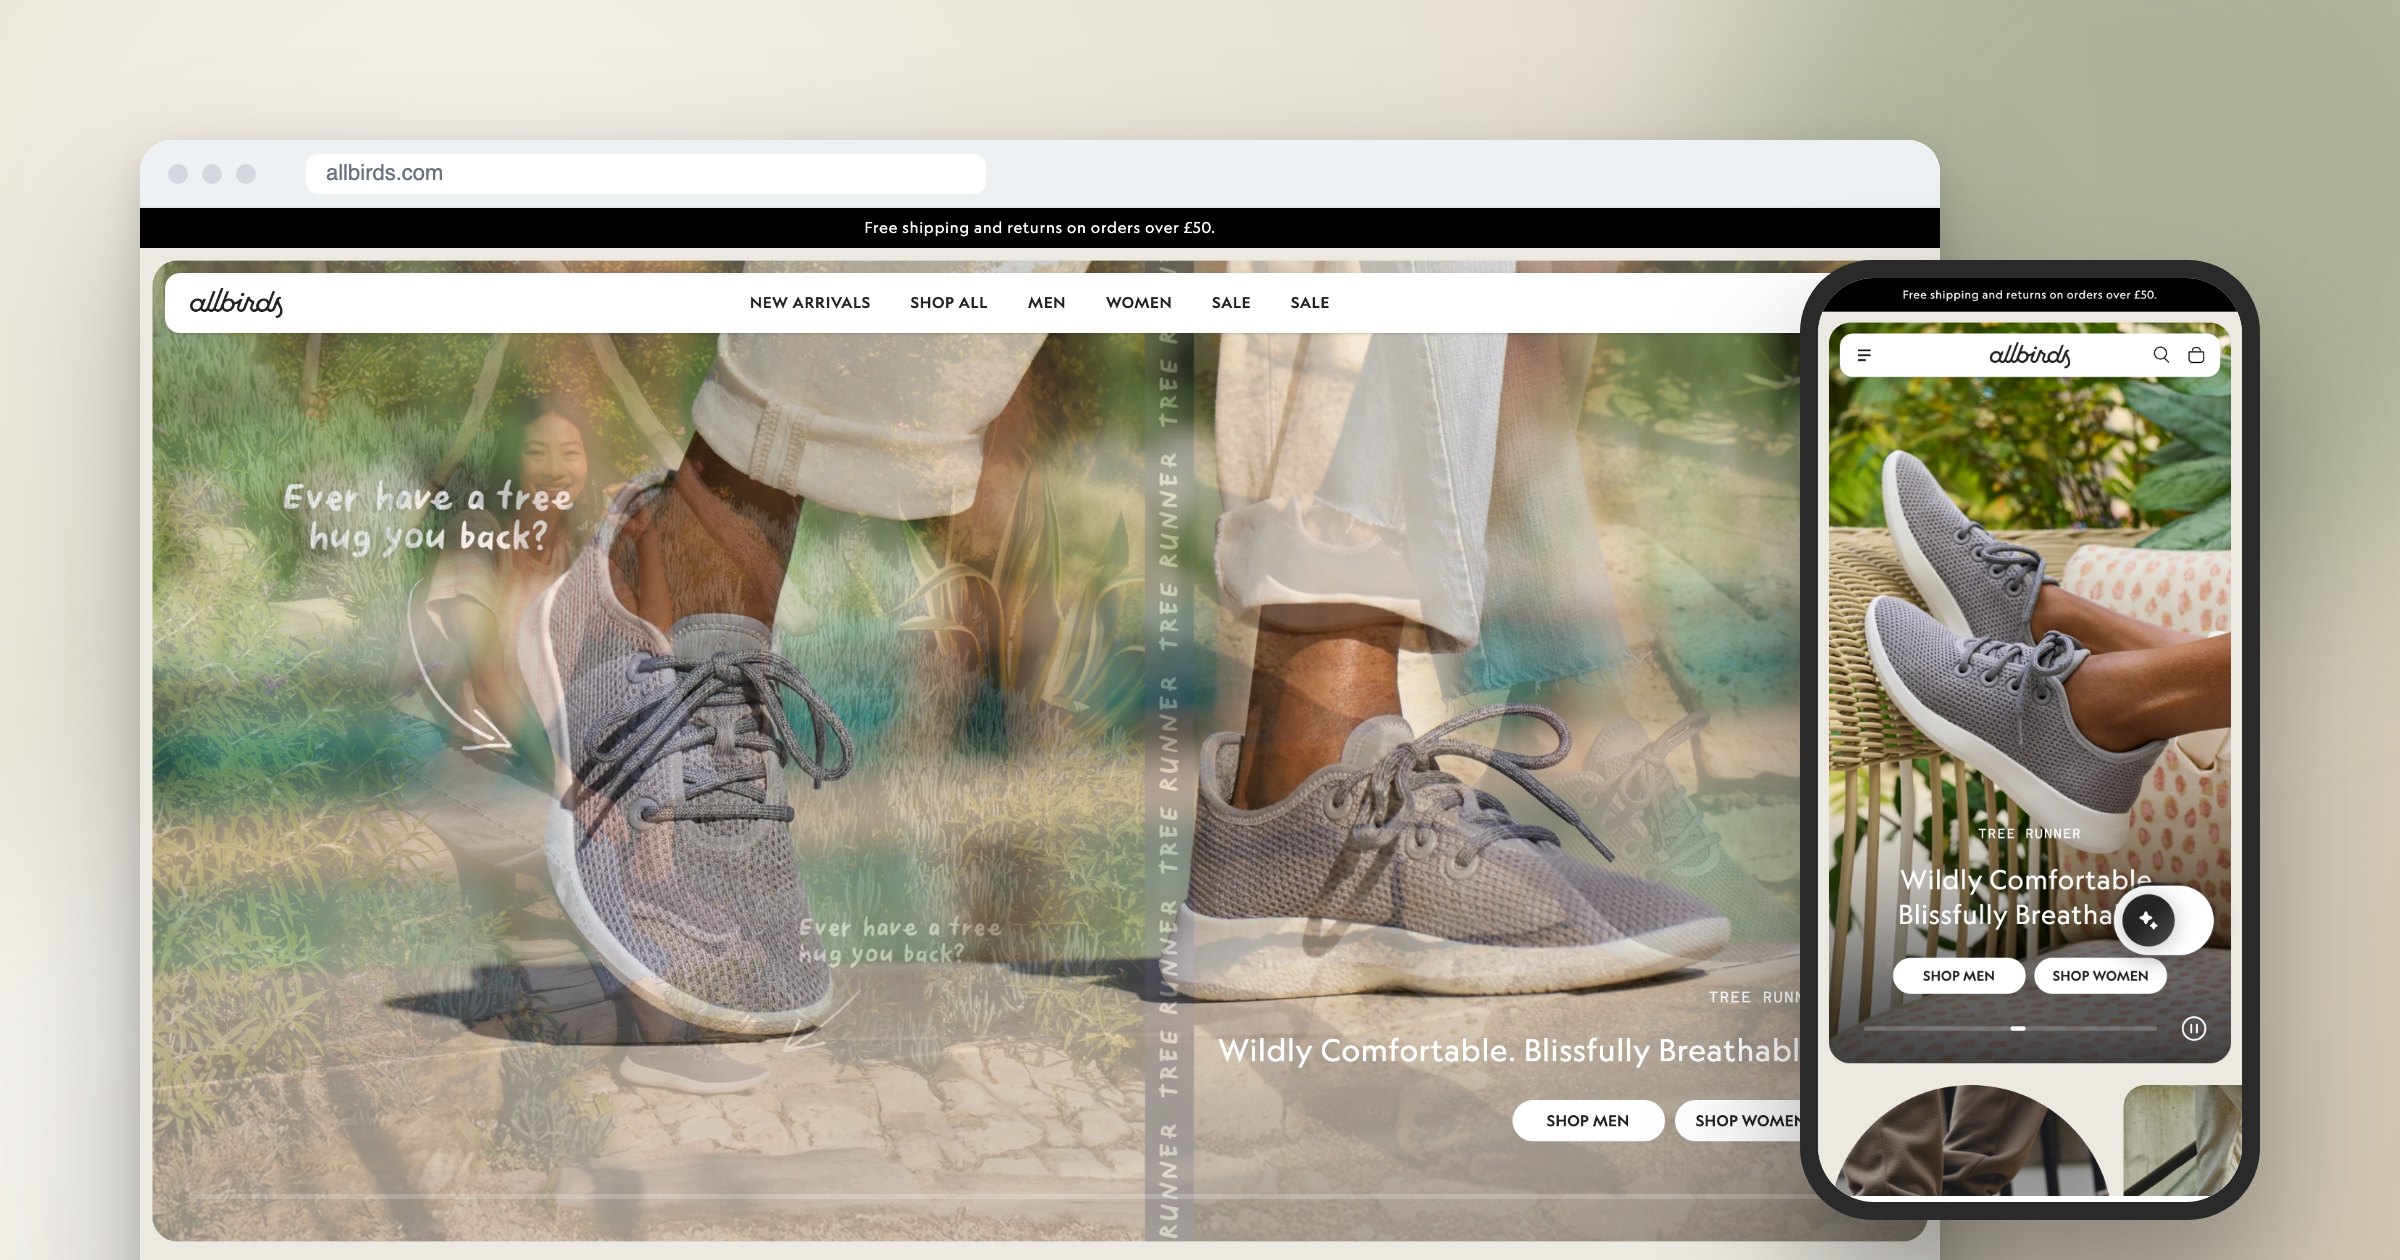
 Visit website
Allbirds
Footwear E-commerce Shopify
A selection of client websites, brand identities, social media posts and reels. Website cards link to the live sites.
Browse websites, brand identity, social media and content creation work.
Business websites, web apps and online stores
Visit websiteFootwear E-commerce Shopify
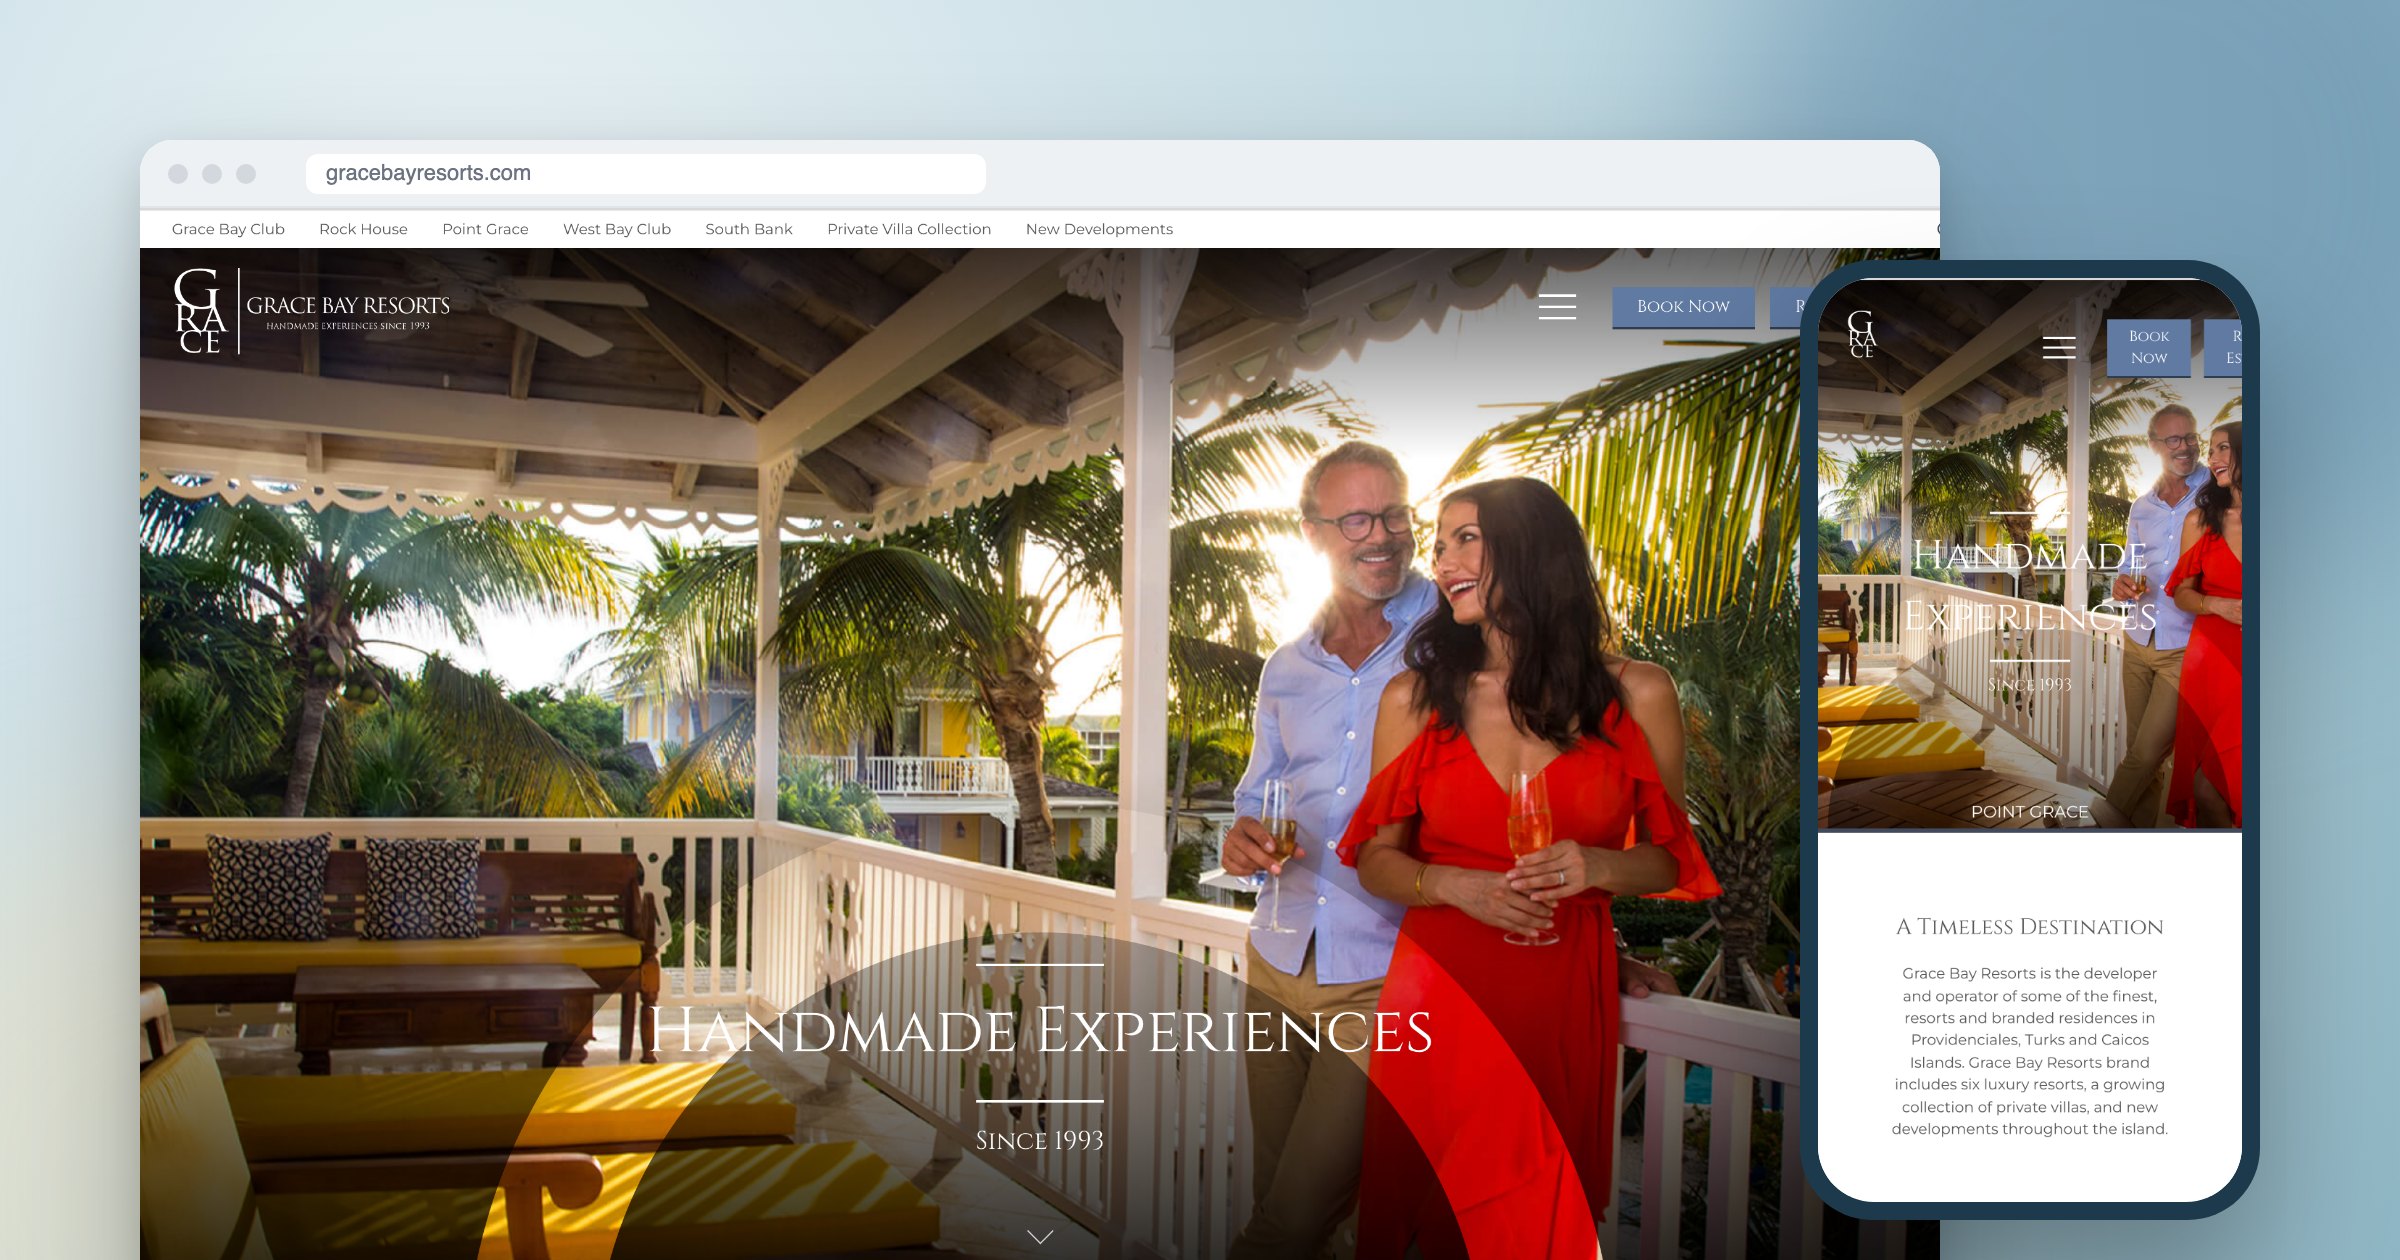 Visit website
Luxury Resort Website
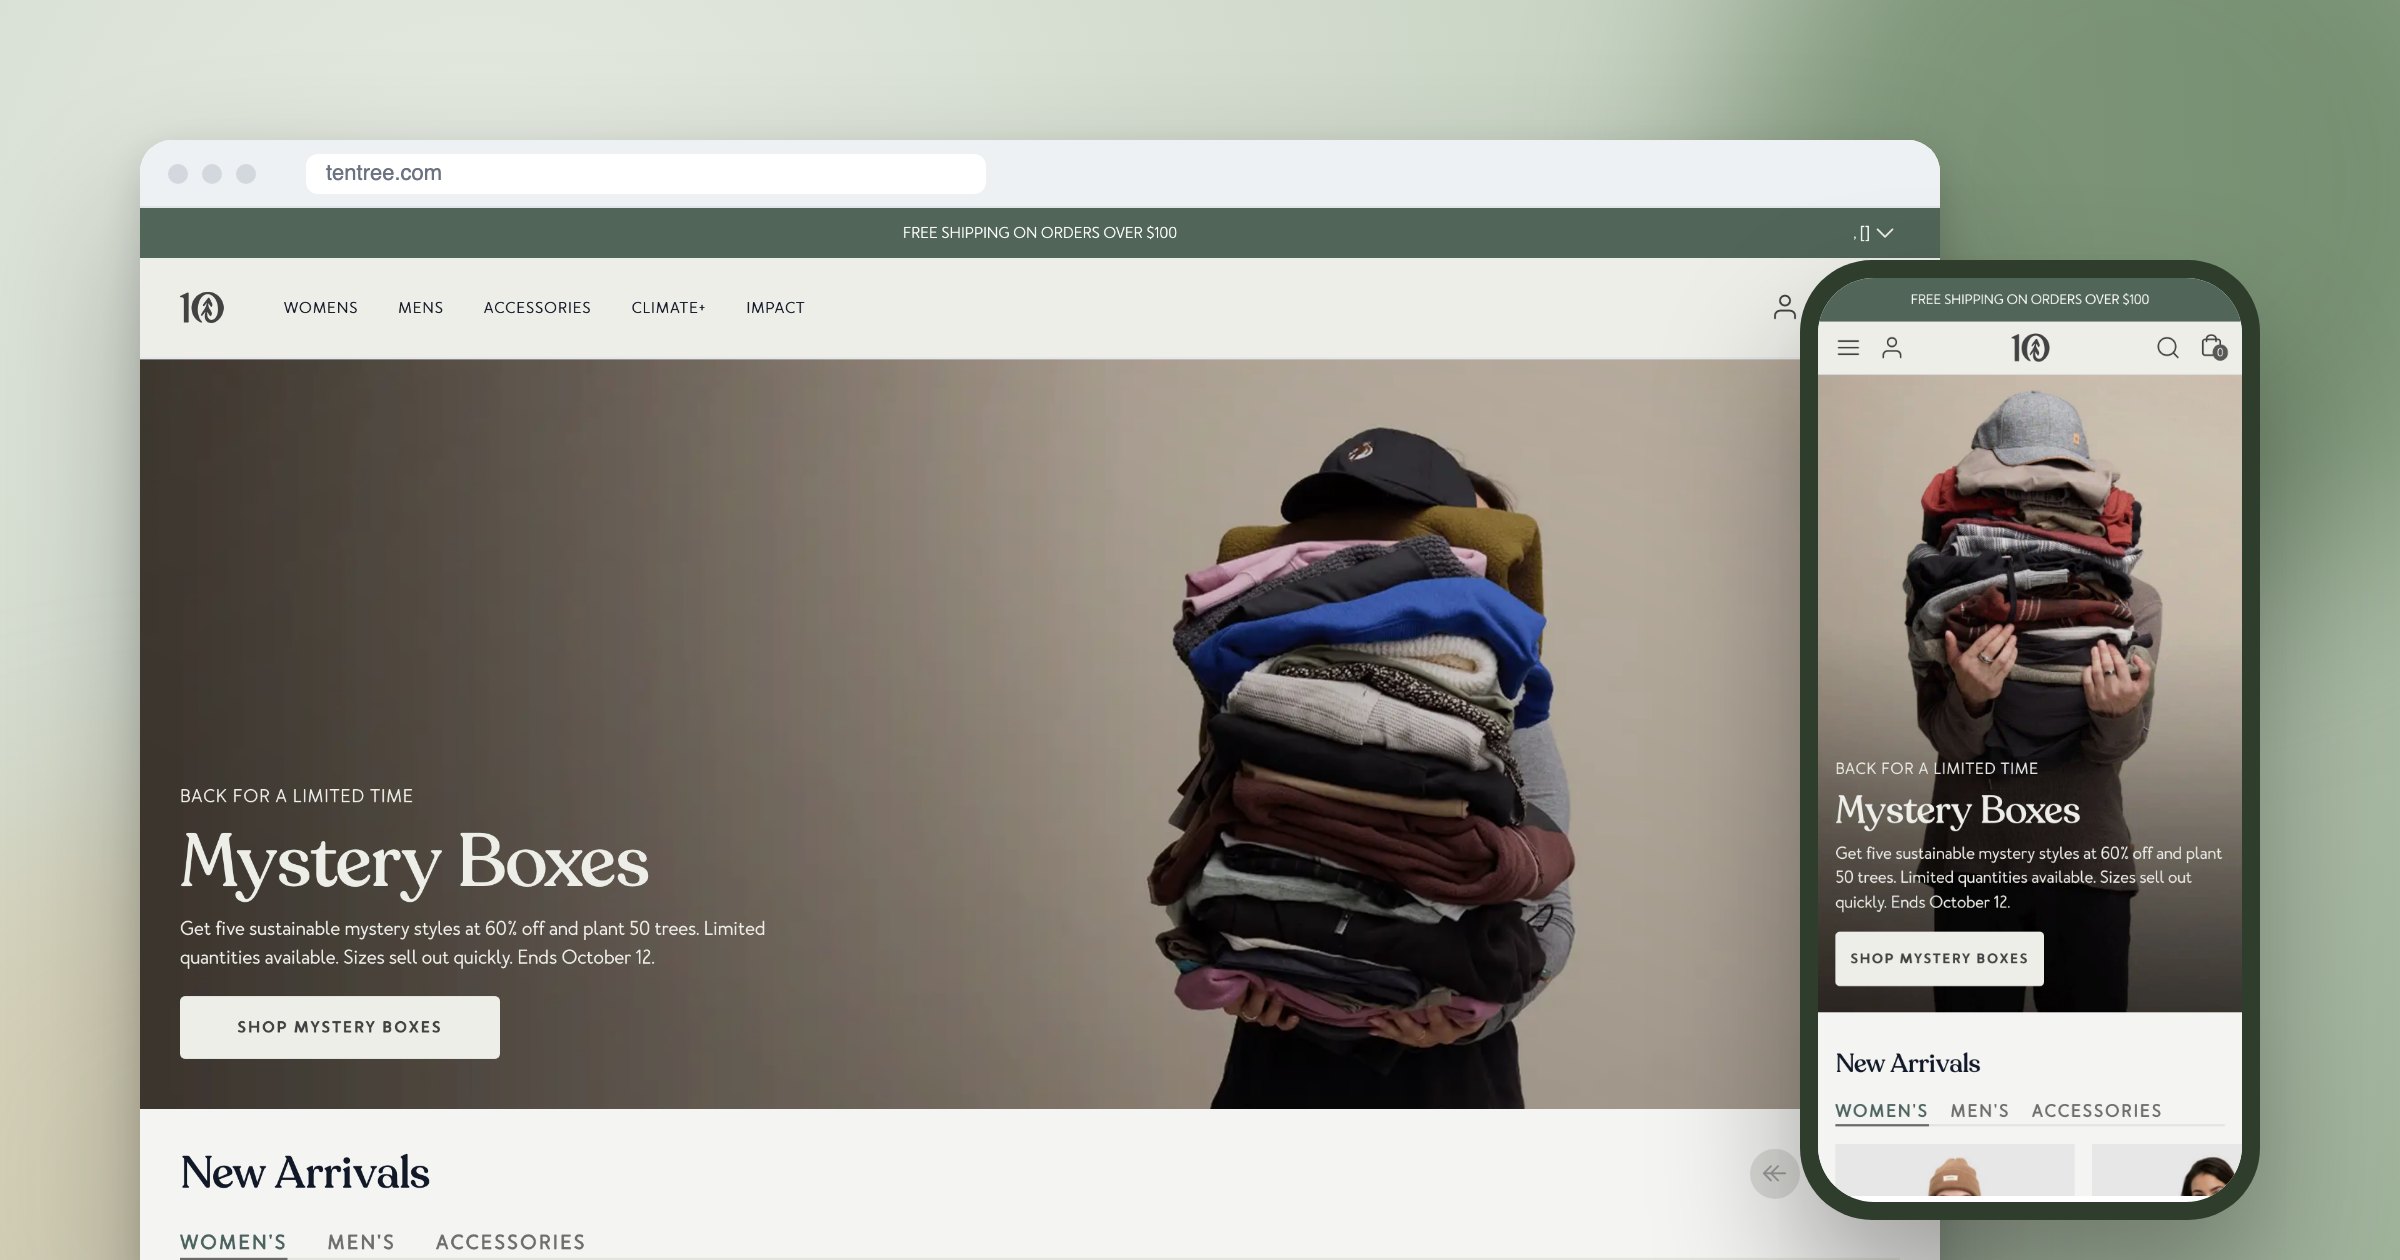 Visit website
Sustainable Apparel E-commerce
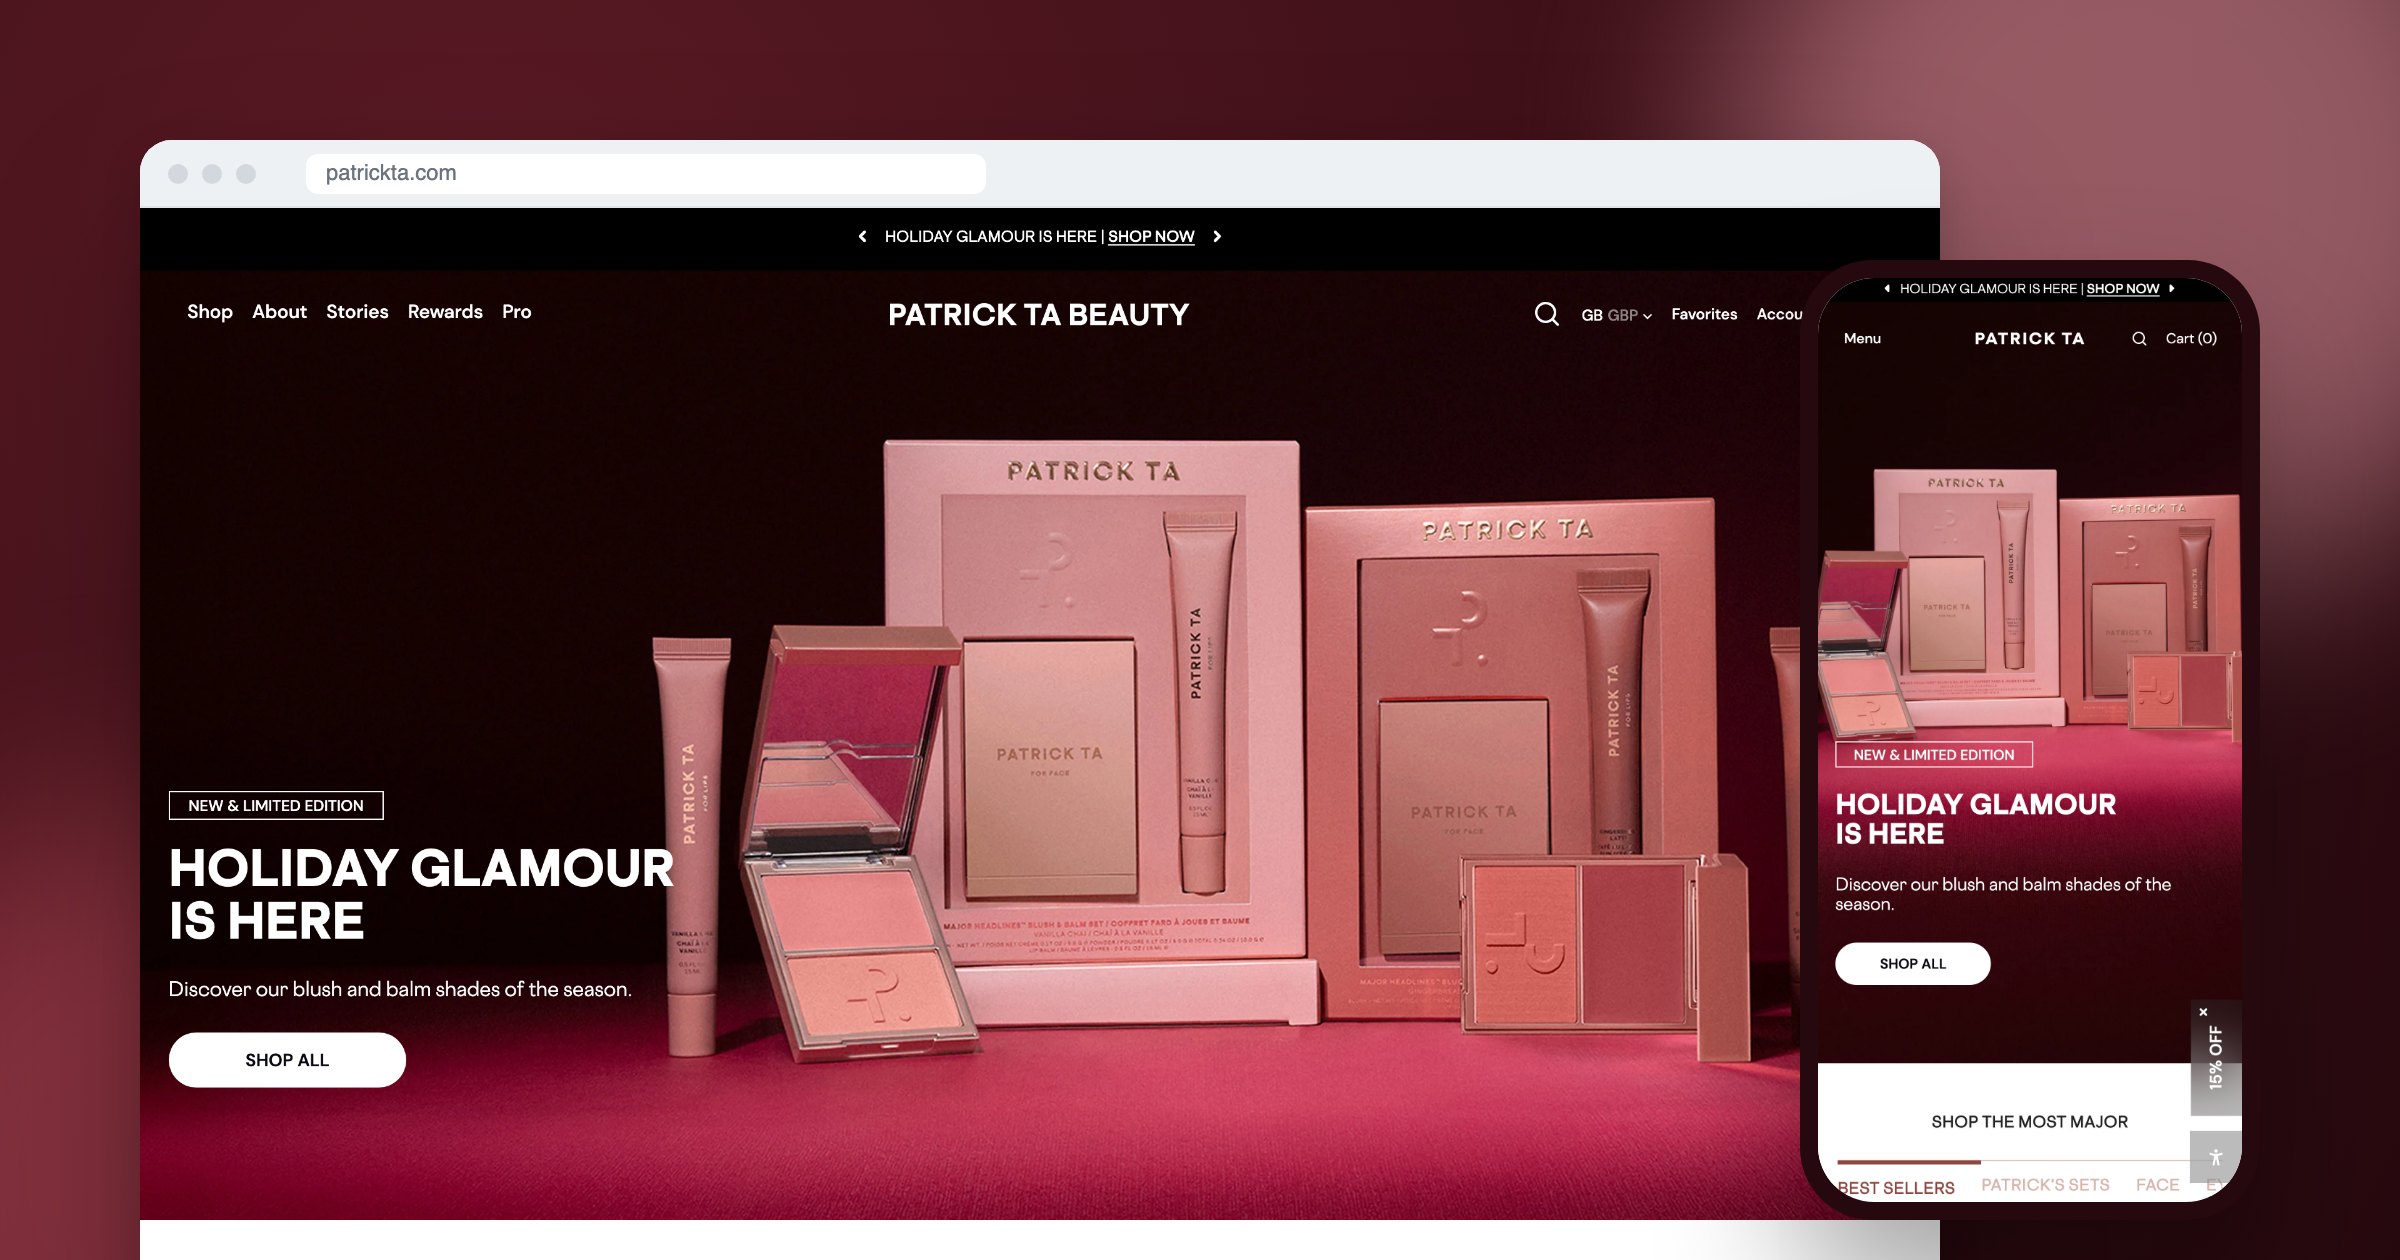 Visit website
Beauty Brand E-commerce
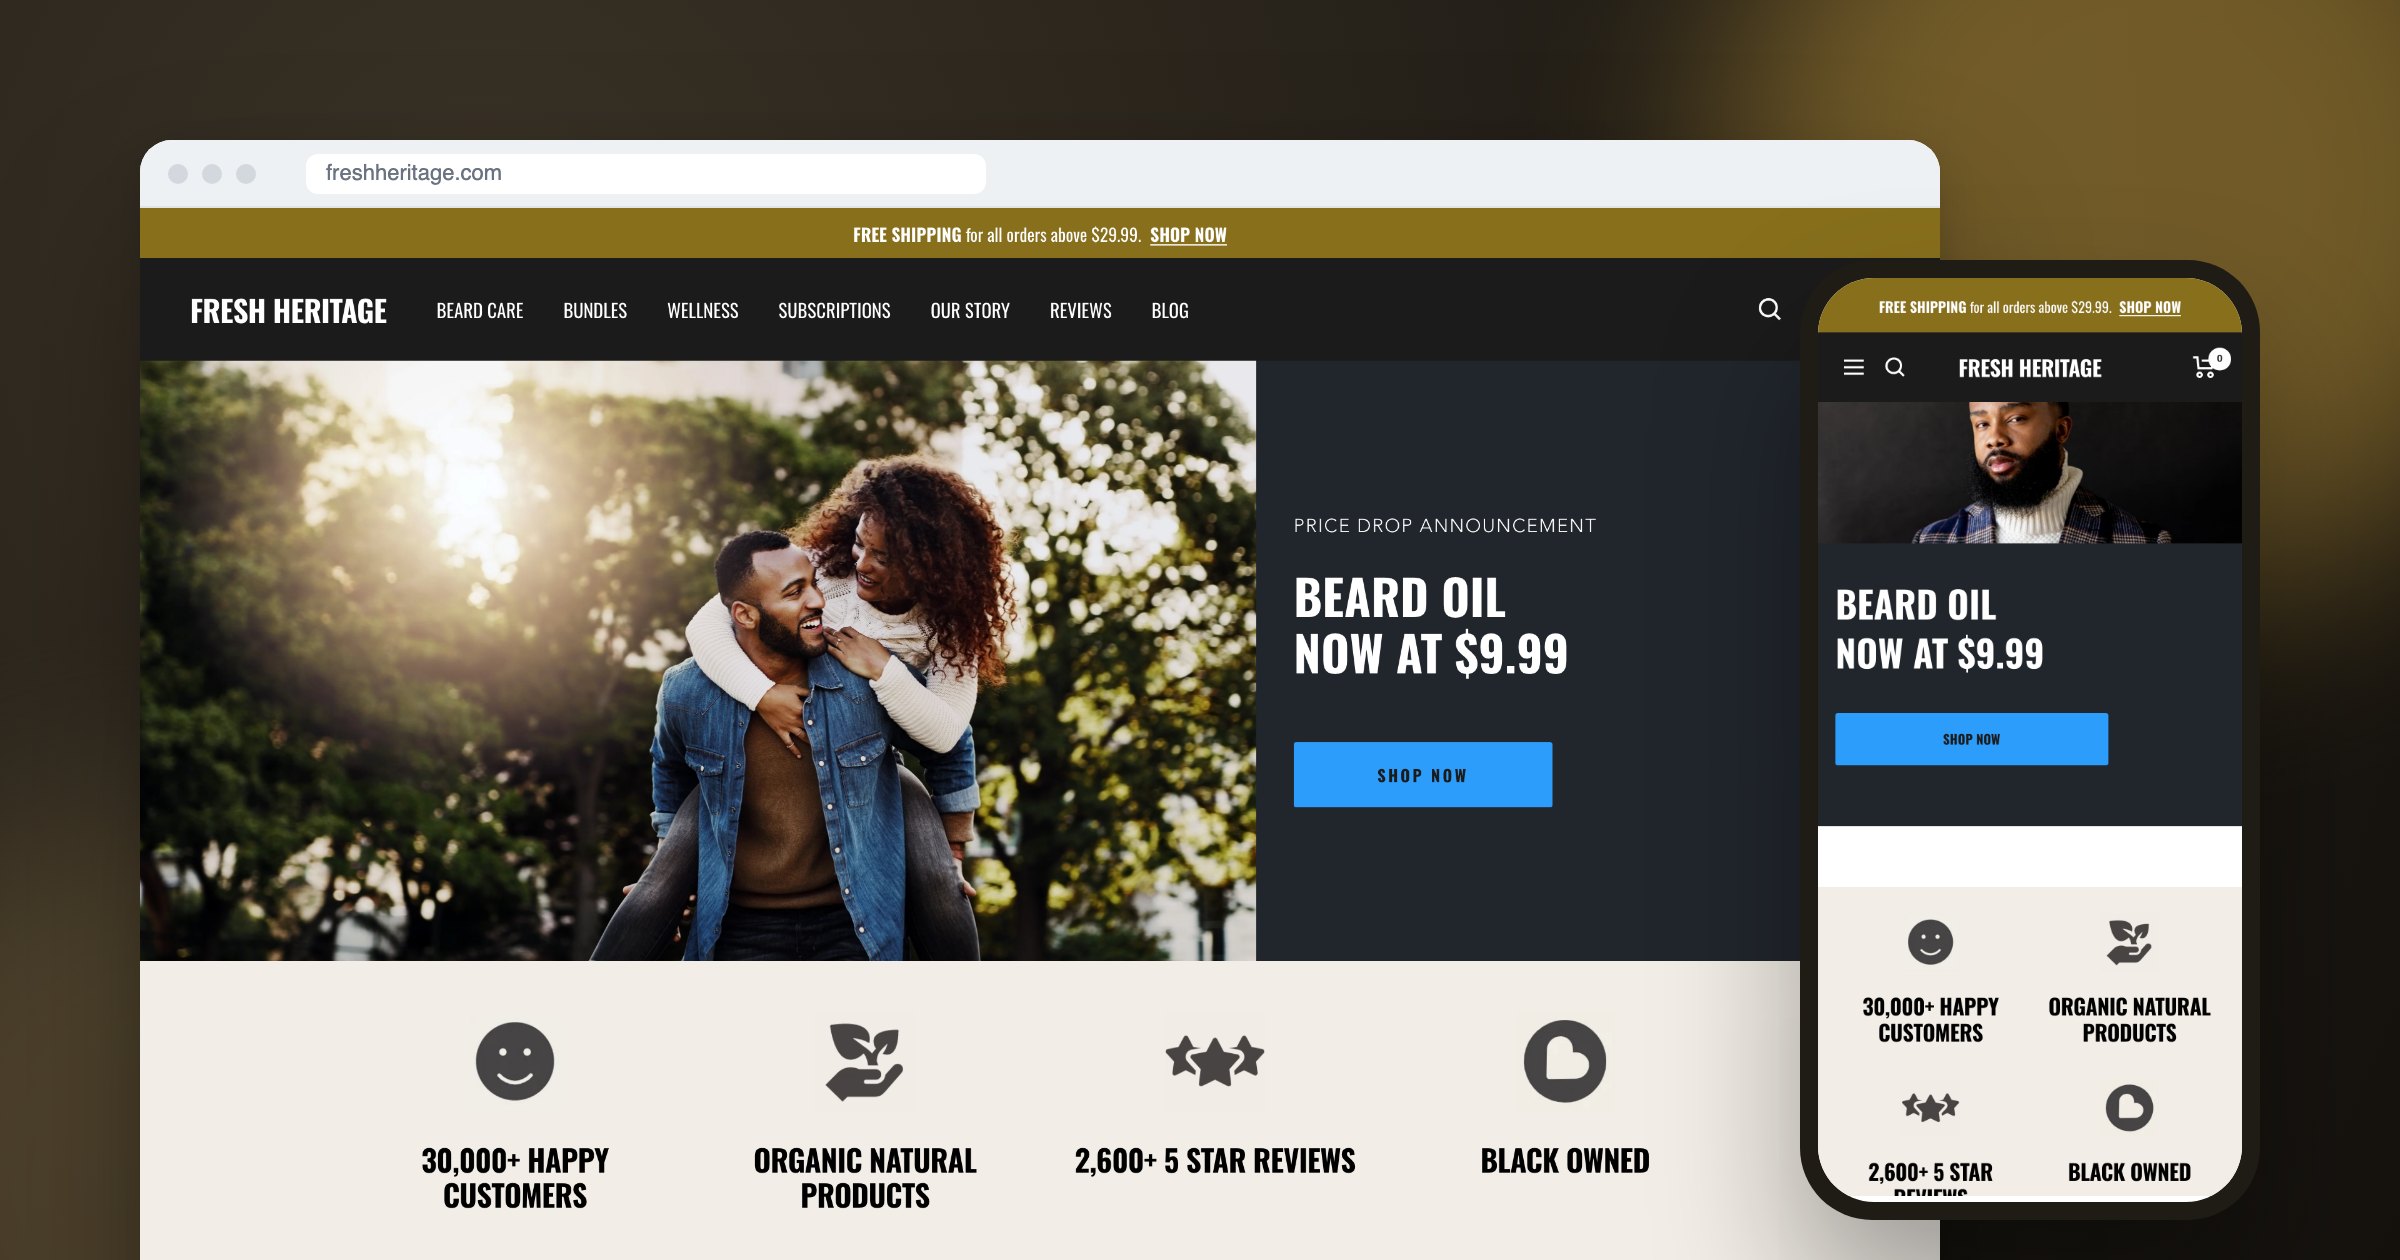 Visit website
Men's Grooming E-commerce
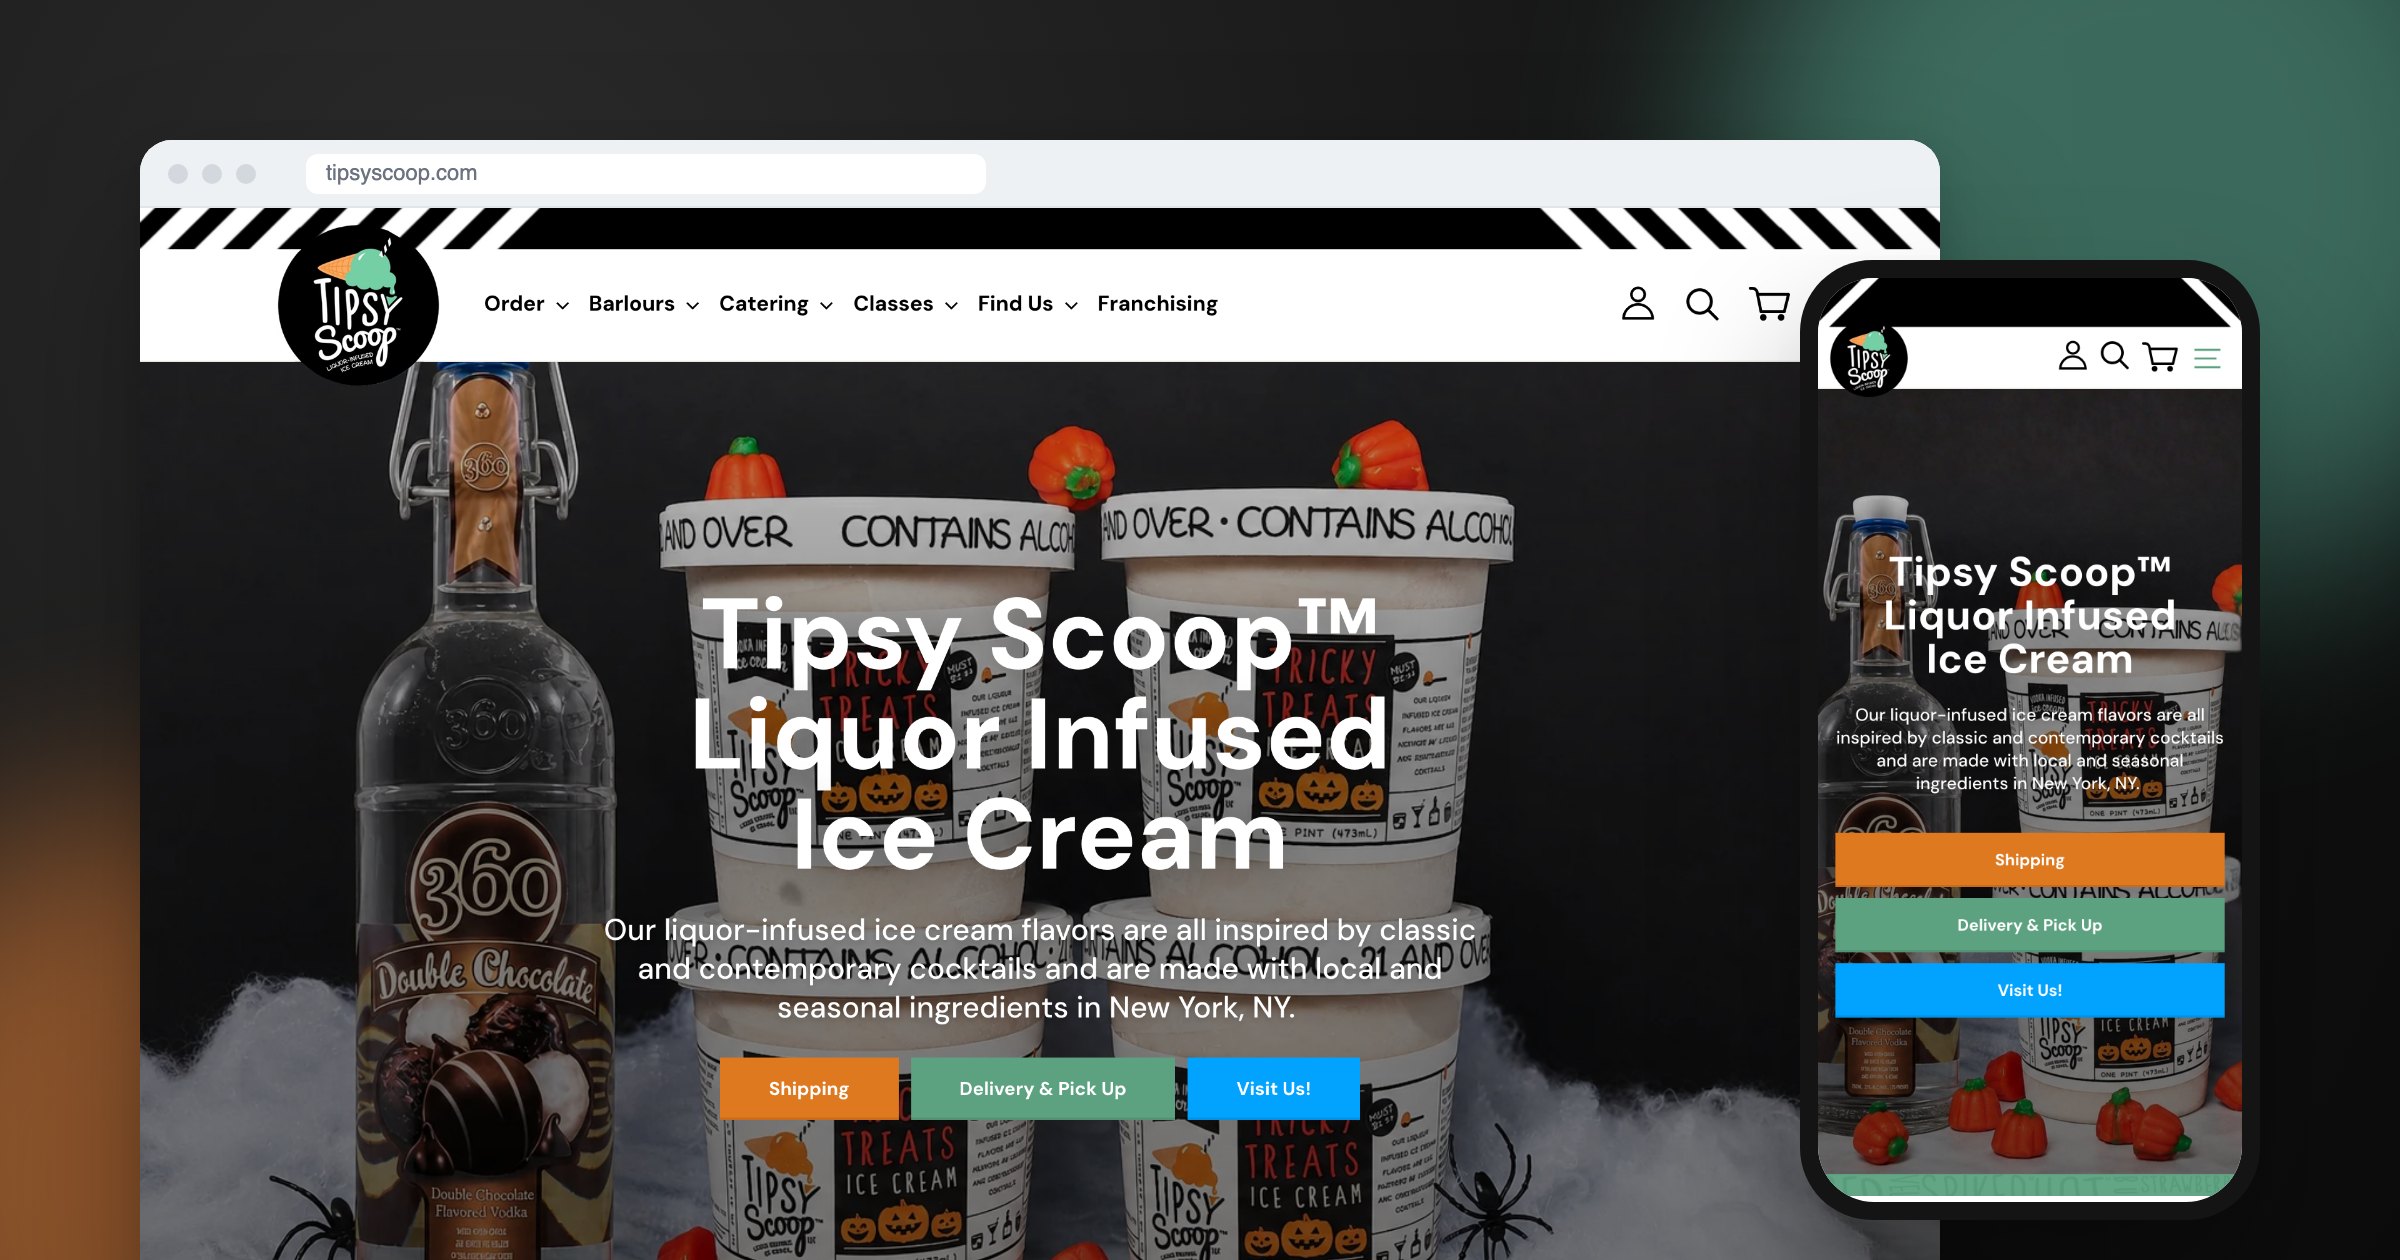 Visit website
Food & Drink E-commerce
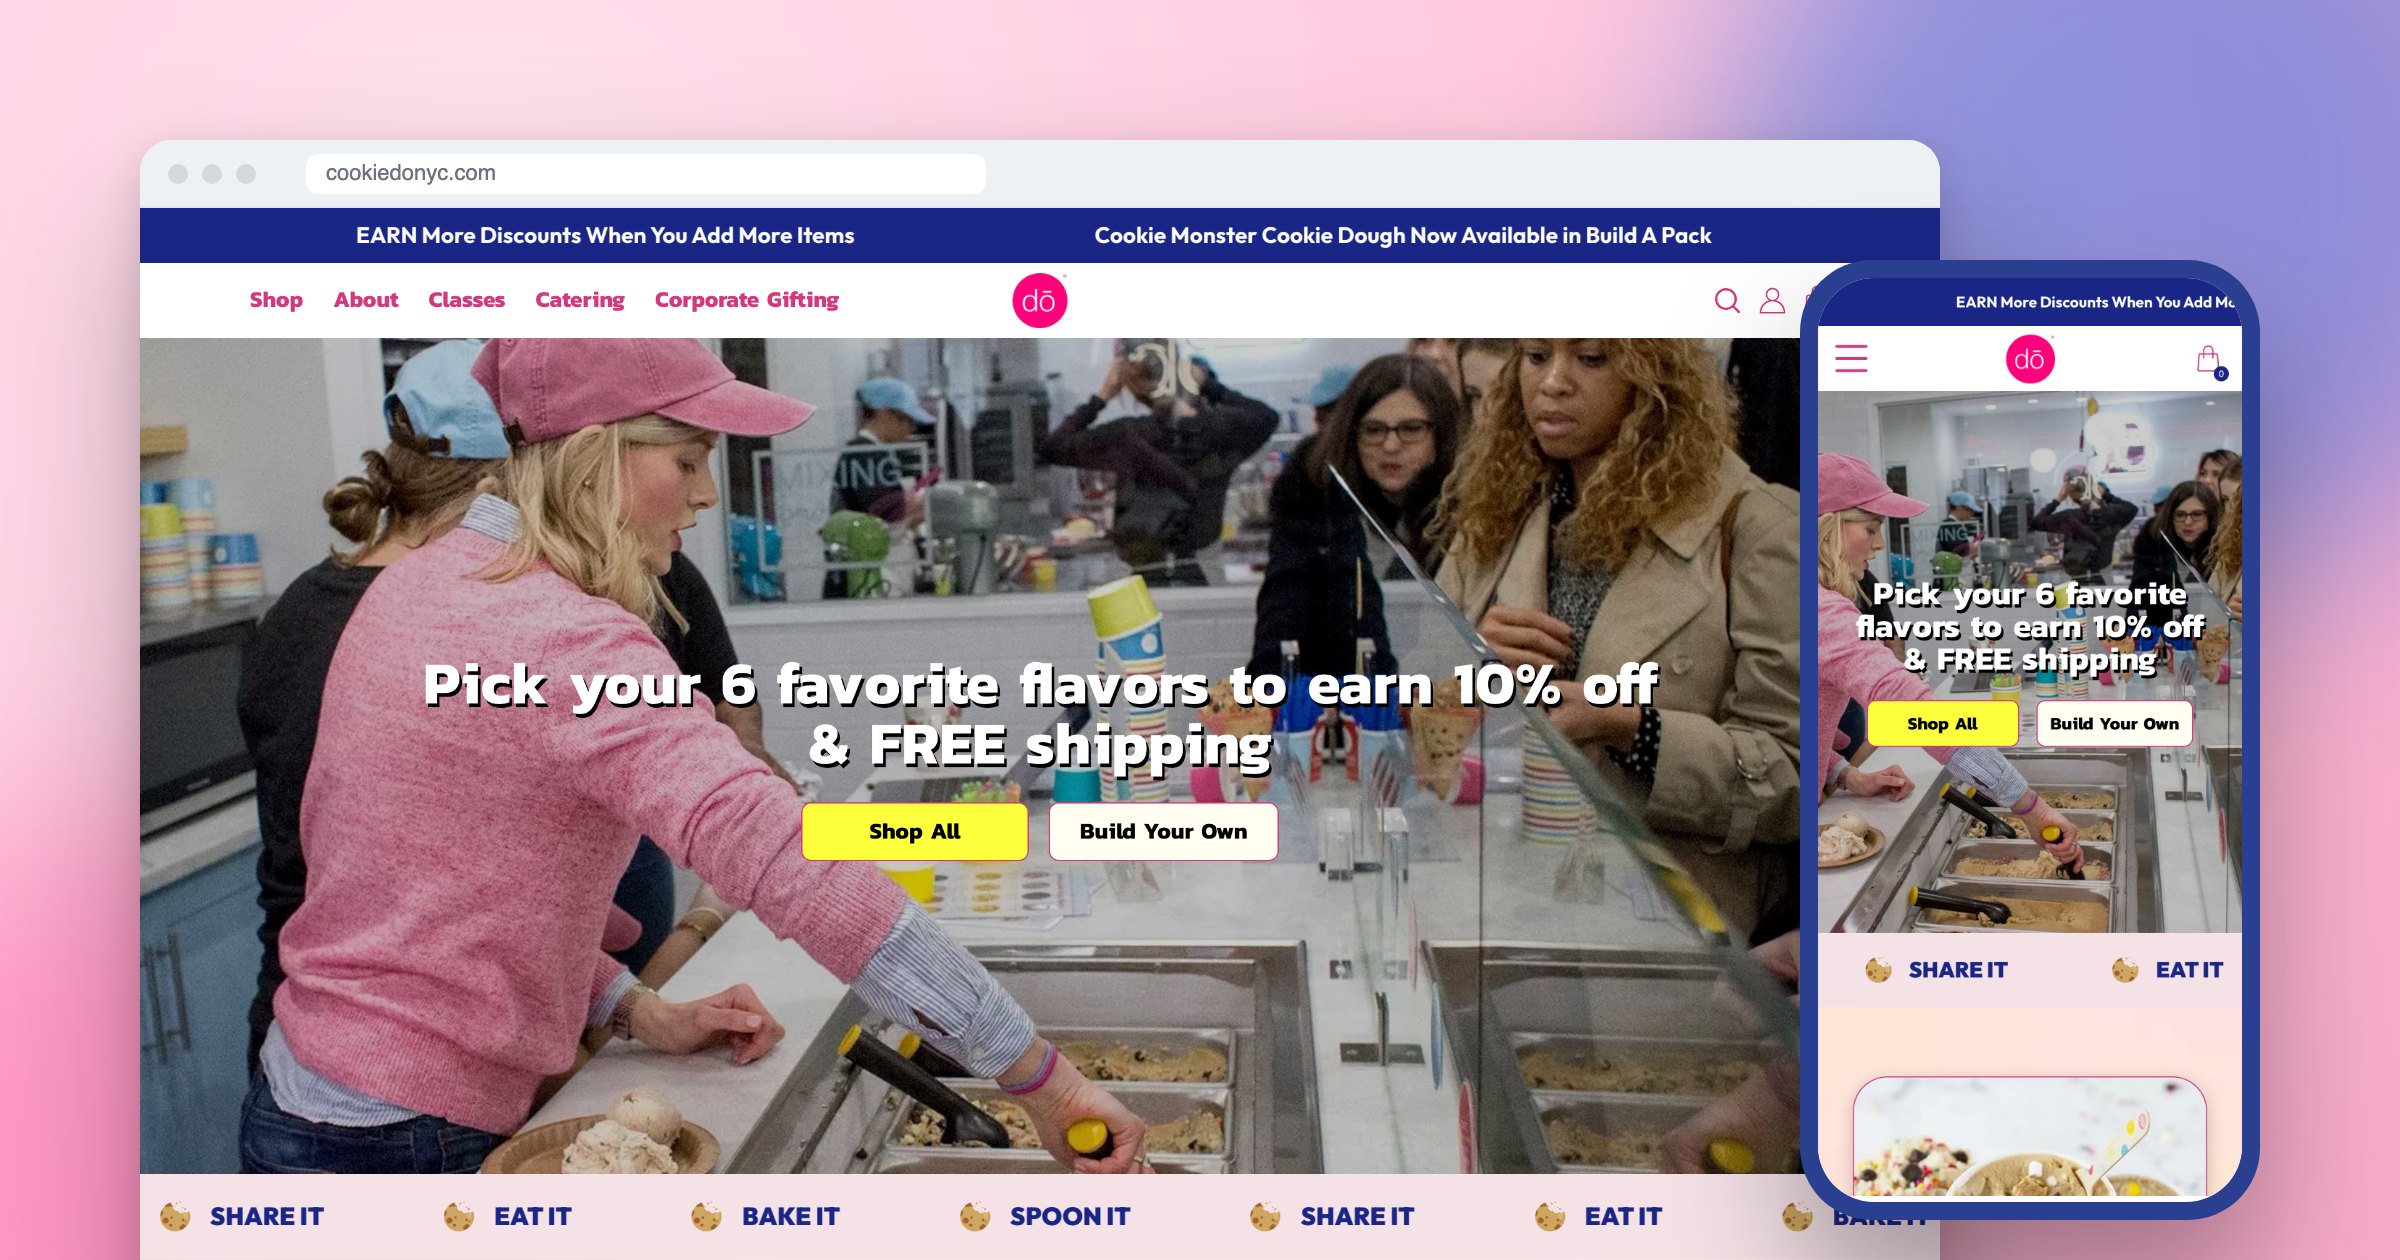 Visit website
Food & Drink E-commerce
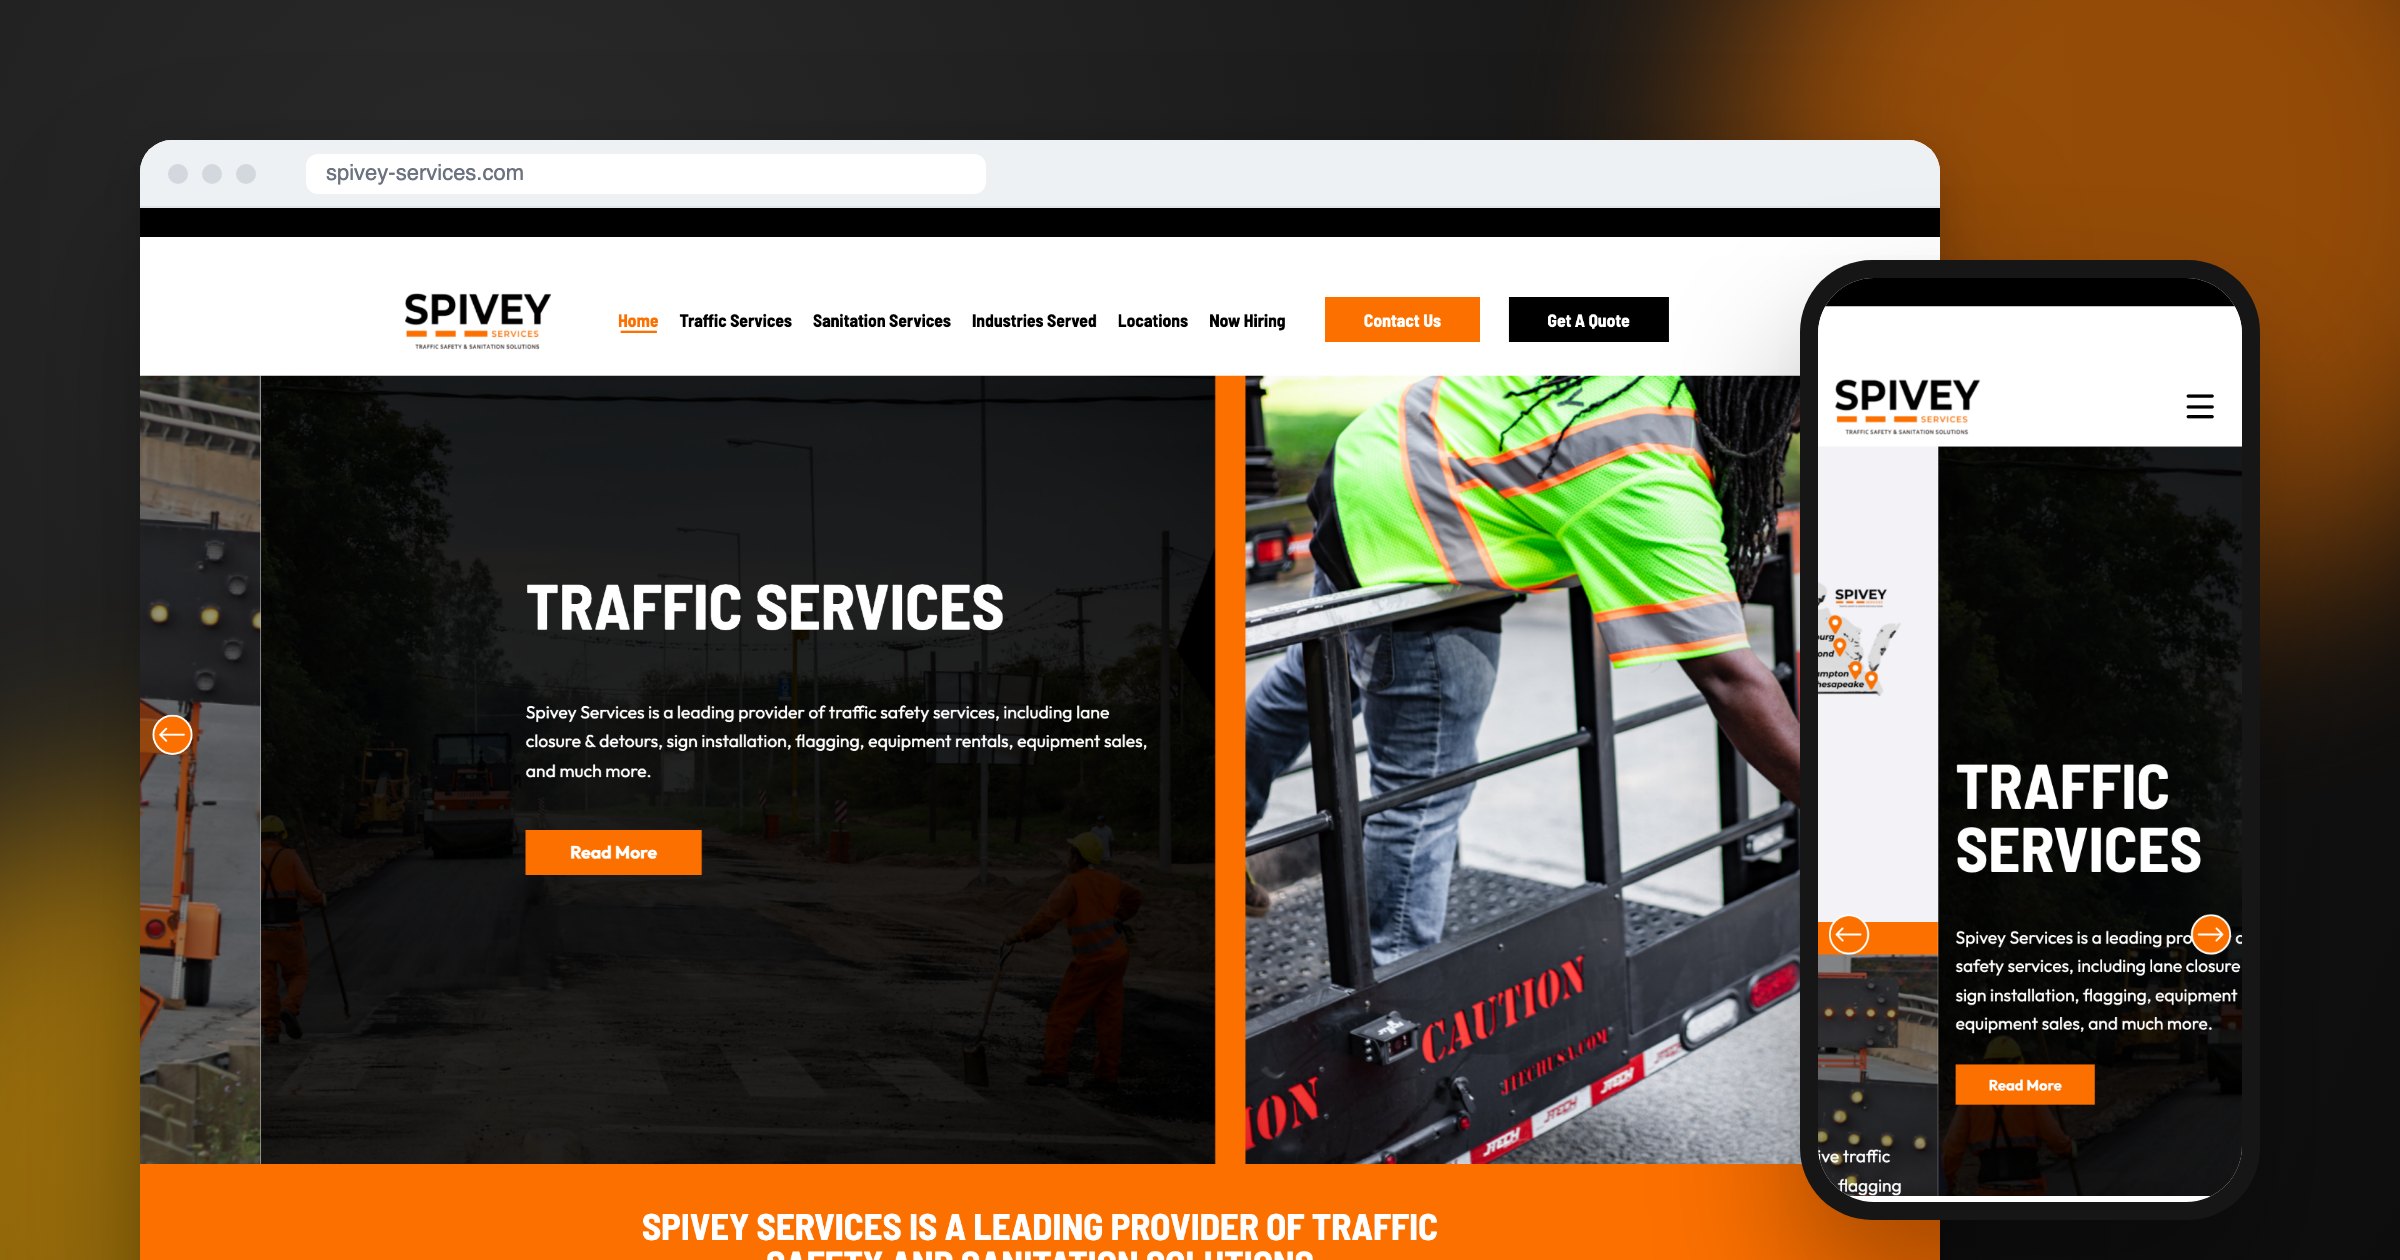 Visit website
Traffic Control & Sanitation Website
Logos, colour, type, packaging and menus
 Brand identity
Brand Identity · Packaging Branding
 Brand identity
Brand Identity · Packaging Branding
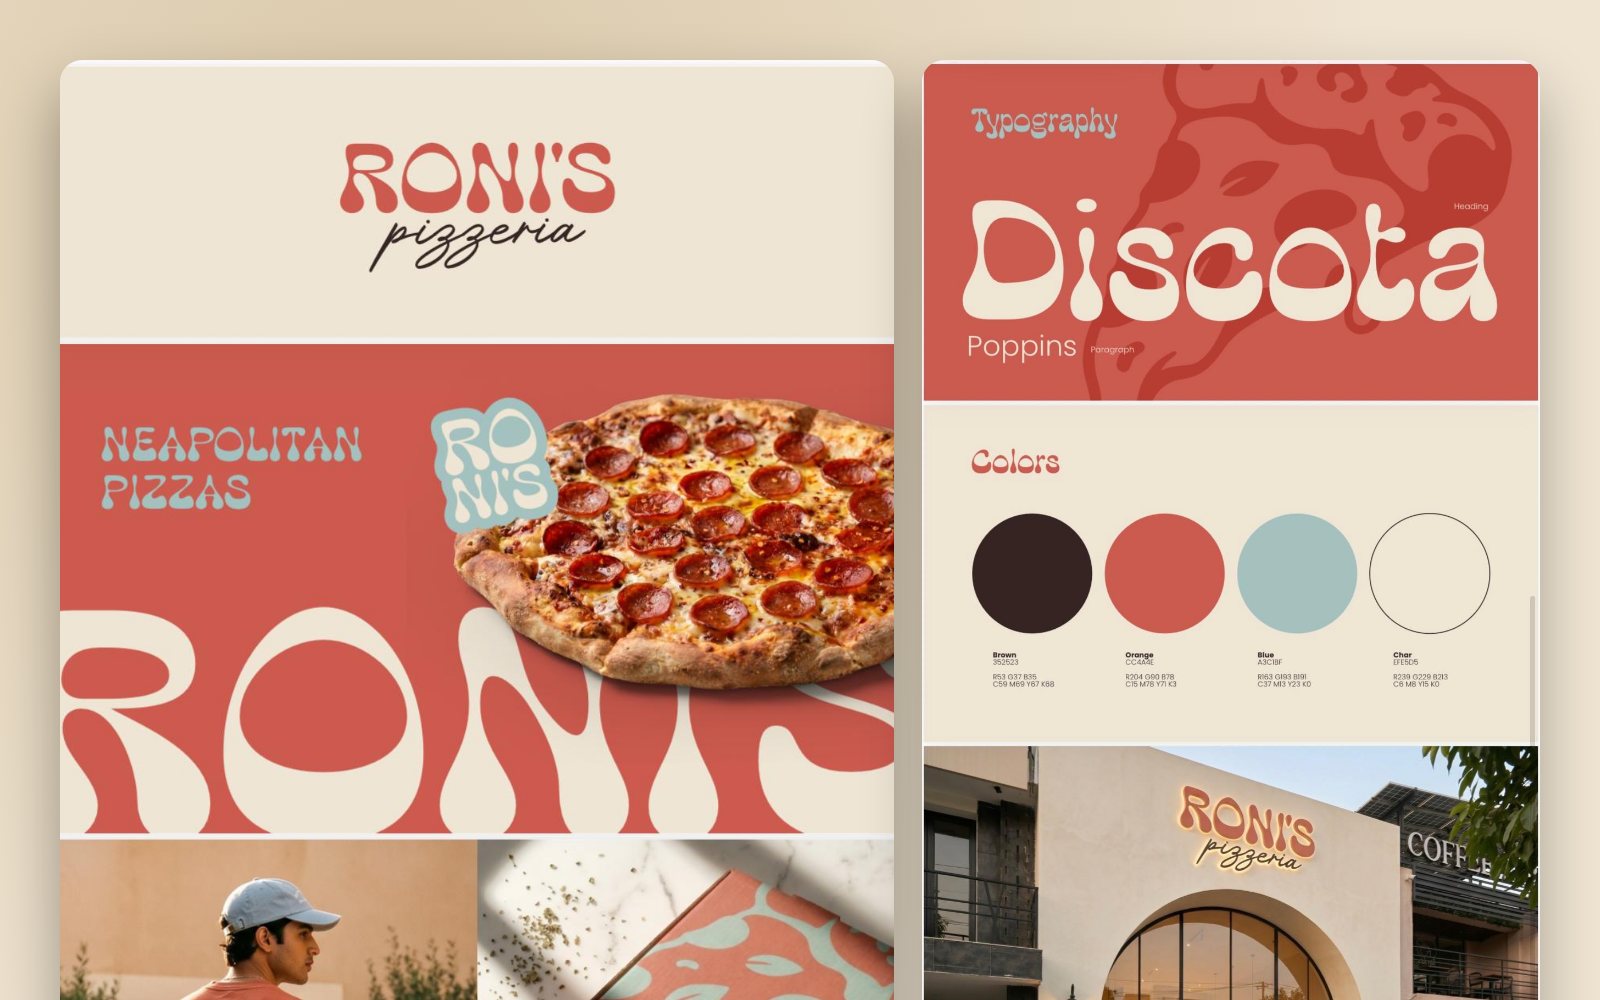 Brand identity
Brand Identity · Menu Design Branding
Posts, campaigns and launch creative
Reels and short-form video
Fizmofx Markets Reel
FBS Reel
SEO case studies
These source screenshots document the search, local visibility and Business Profile signals available at the time of reporting. Each note describes only the values and time period visible in its image.
Search Console and third-party SEO snapshots capture clicks, impressions, positions and organic-traffic indicators.
Grid reports show how priority service queries appeared across the mapped areas in each supplied view.
Business Profile reports make the call, website-click and interaction activity visible alongside date ranges.
Performance reporting is used to connect visibility, engagement and ranking signals—not to present a single number in isolation.
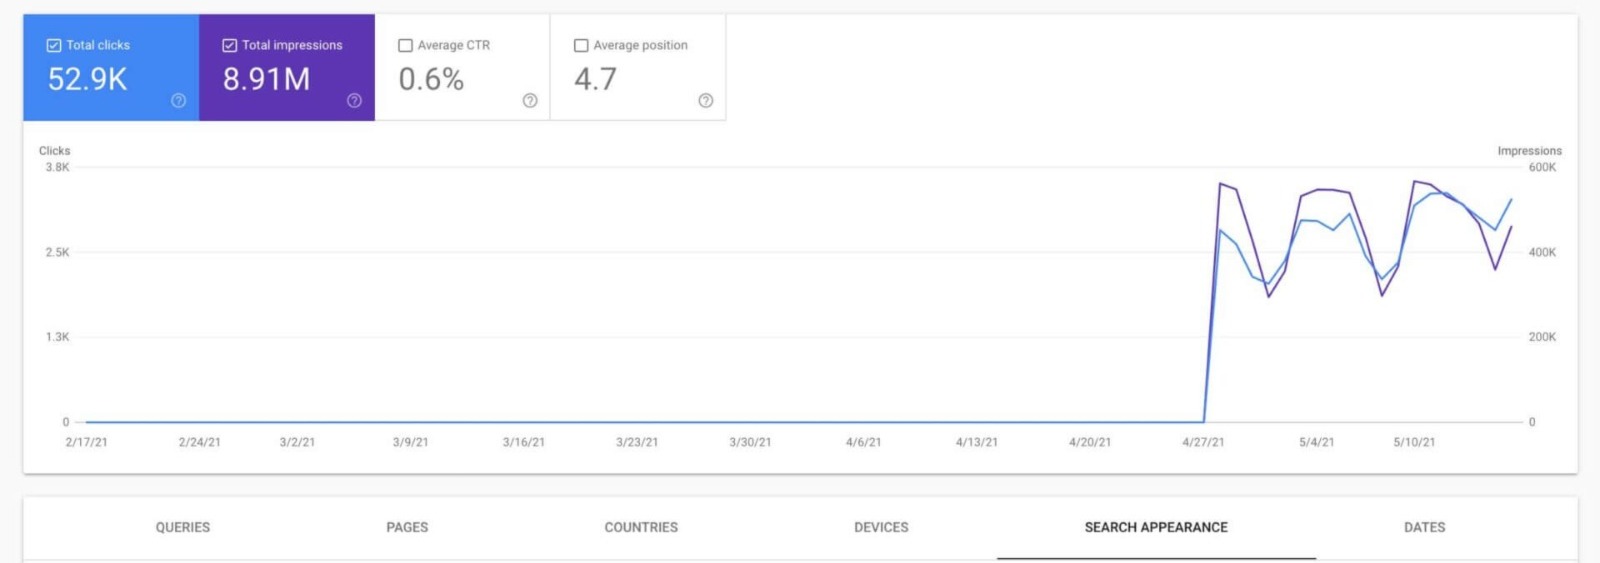
The supplied report shows 52.9K total clicks, 8.91M impressions, a 0.6% average CTR and average position 4.7. The chart’s activity begins in late April within the displayed range.
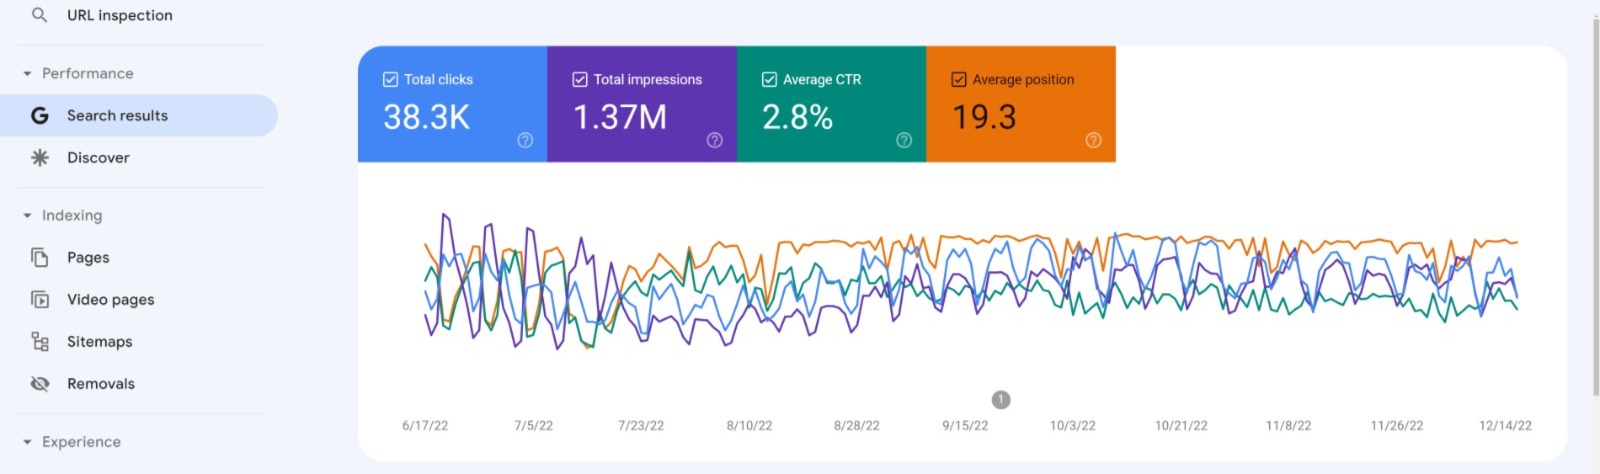
This view records 38.3K clicks, 1.37M impressions, 2.8% average CTR and average position 19.3. Reviewing the four measures together keeps visibility and click-through activity in context.
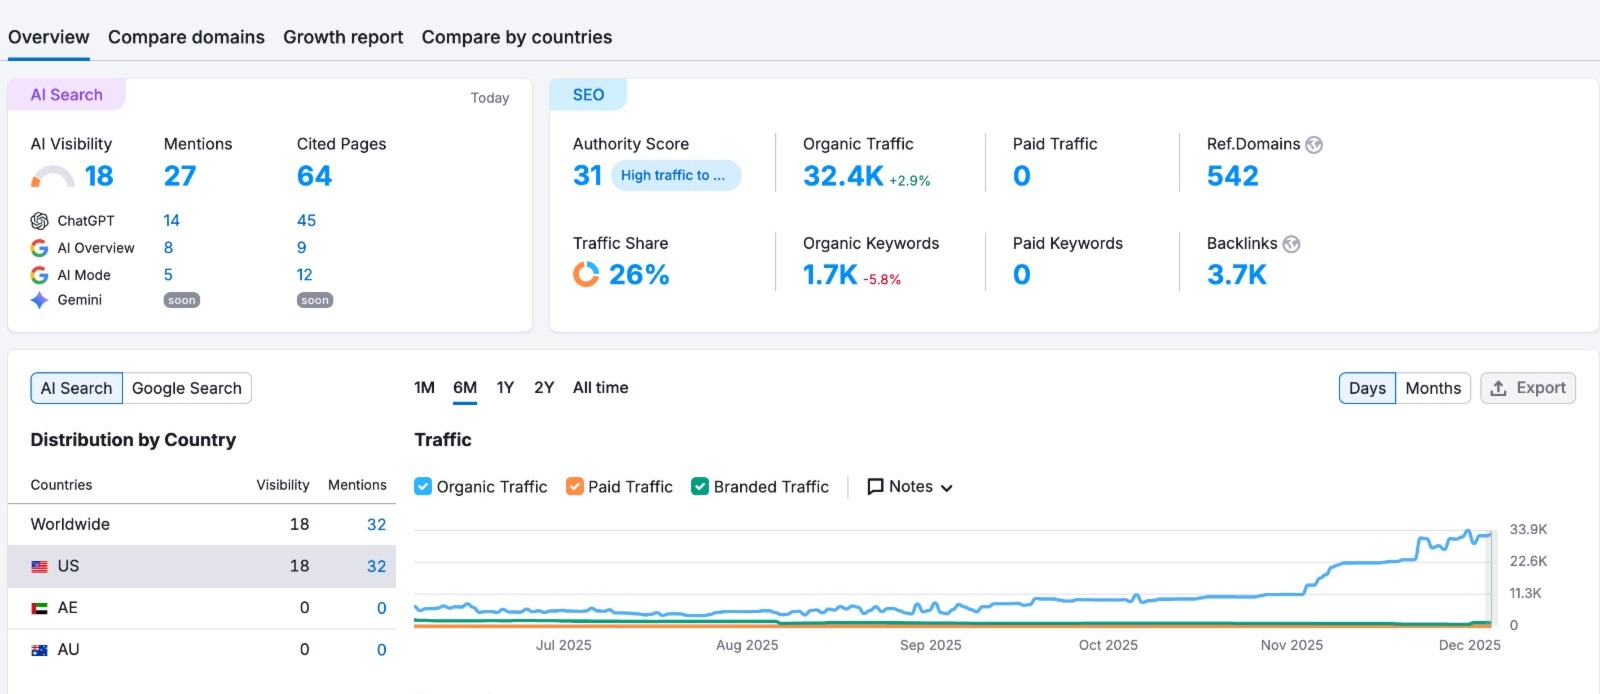
The screenshot shows organic traffic of 32.4K with a +2.9% indicator, authority score 31, 1.7K organic keywords, 542 referring domains and 3.7K backlinks. The visible trend rises sharply near the end of the July–December 2025 view.
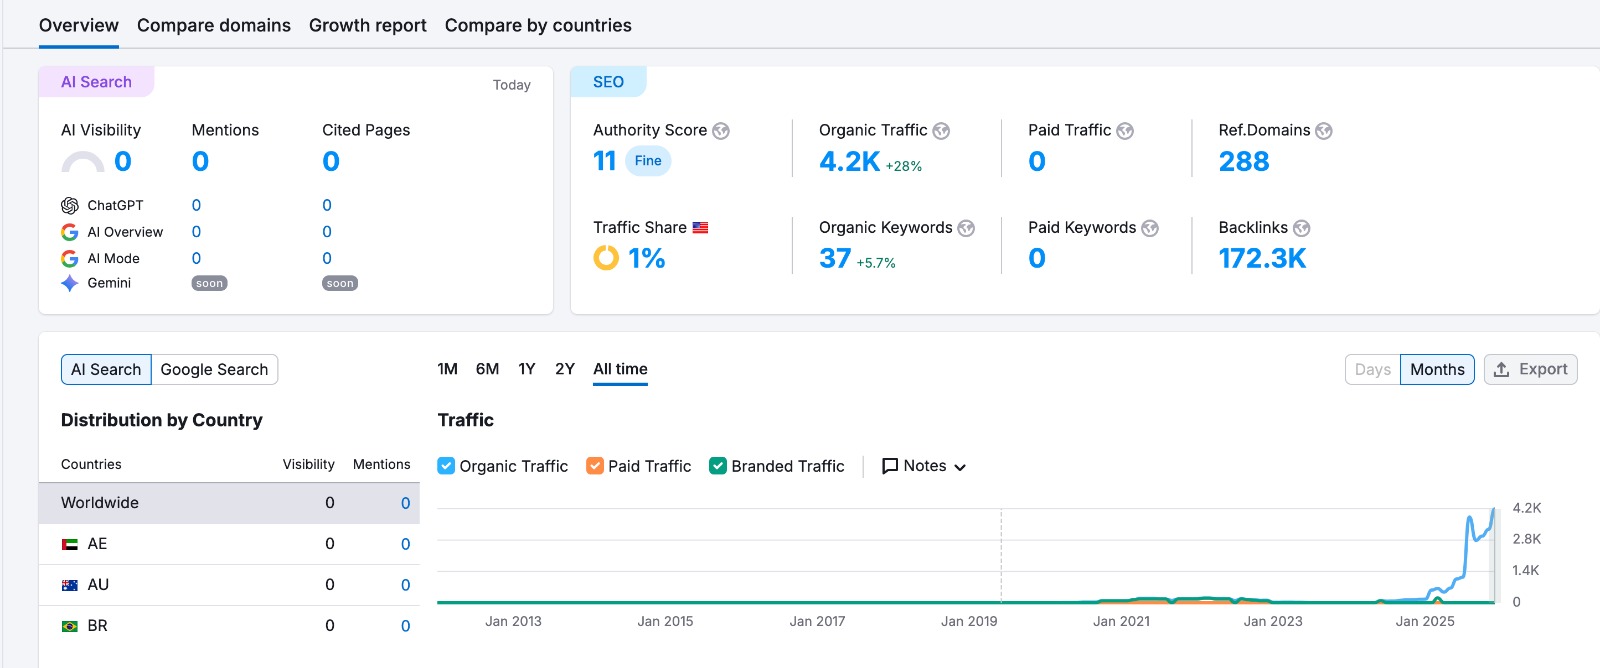
This report displays 4.2K organic traffic with a +28% indicator, 37 organic keywords, 288 referring domains and 172.3K backlinks. The chart shows its strongest visible movement at the end of the series.
Grid-based reporting makes local rank distribution easier to review than a single-point result. The maps below retain the exact queries and rank summaries shown by the source.
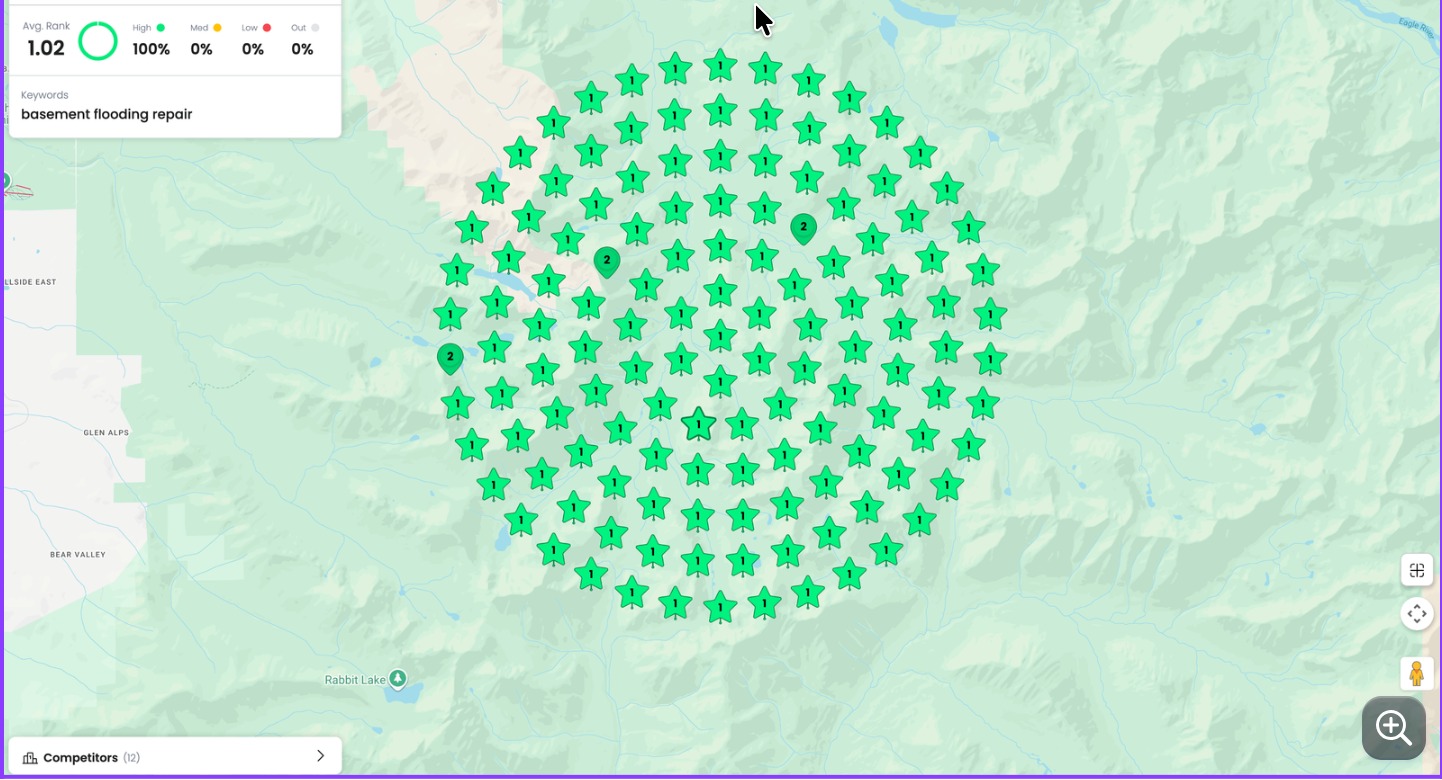
The supplied map reports average rank 1.02 and 100% in the “High” category for “basement flooding repair.” The green markers display first-place positions across the visible grid.
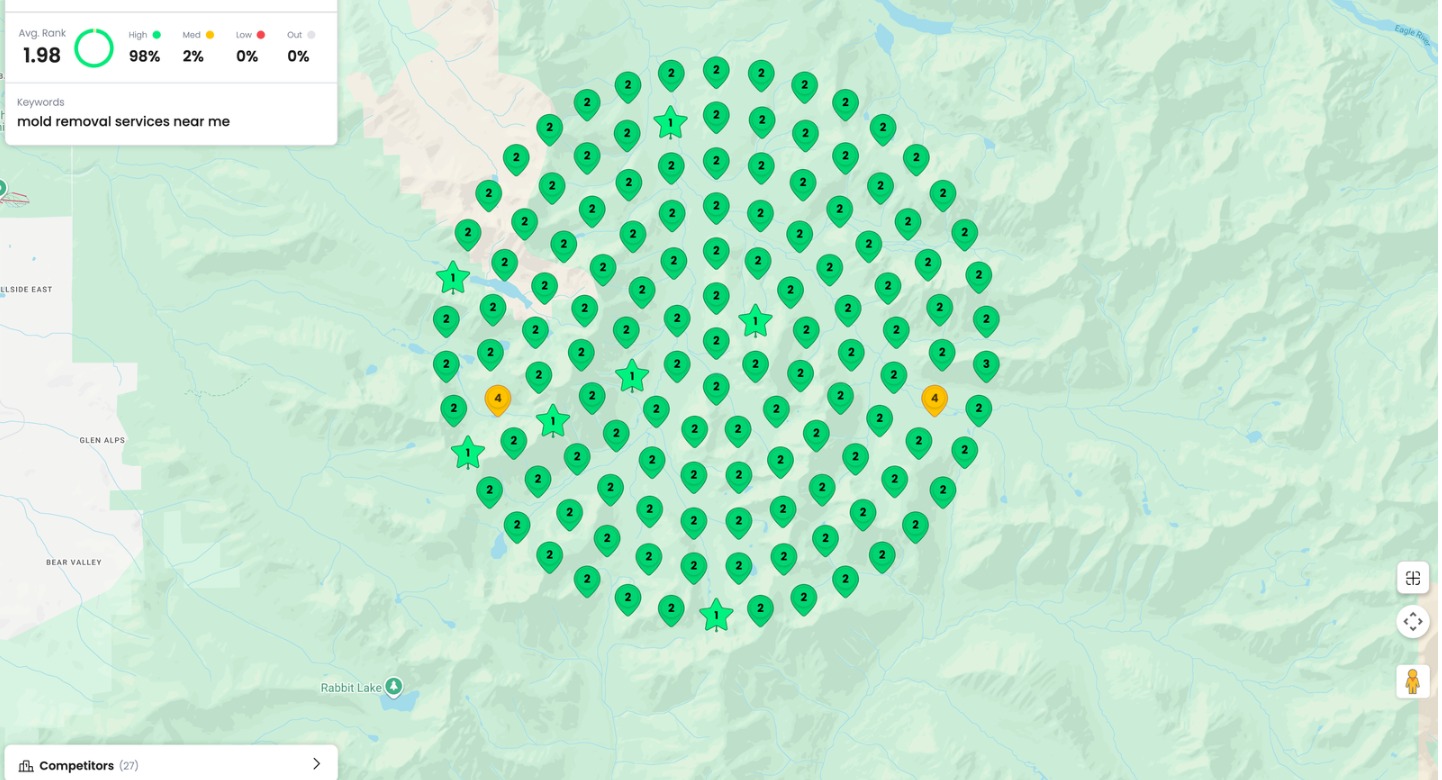
For “mold removal services near me,” the map shows average rank 1.98, with 98% High and 2% Medium markers. Most visible points display position 2, with a small number of other shown ranks.
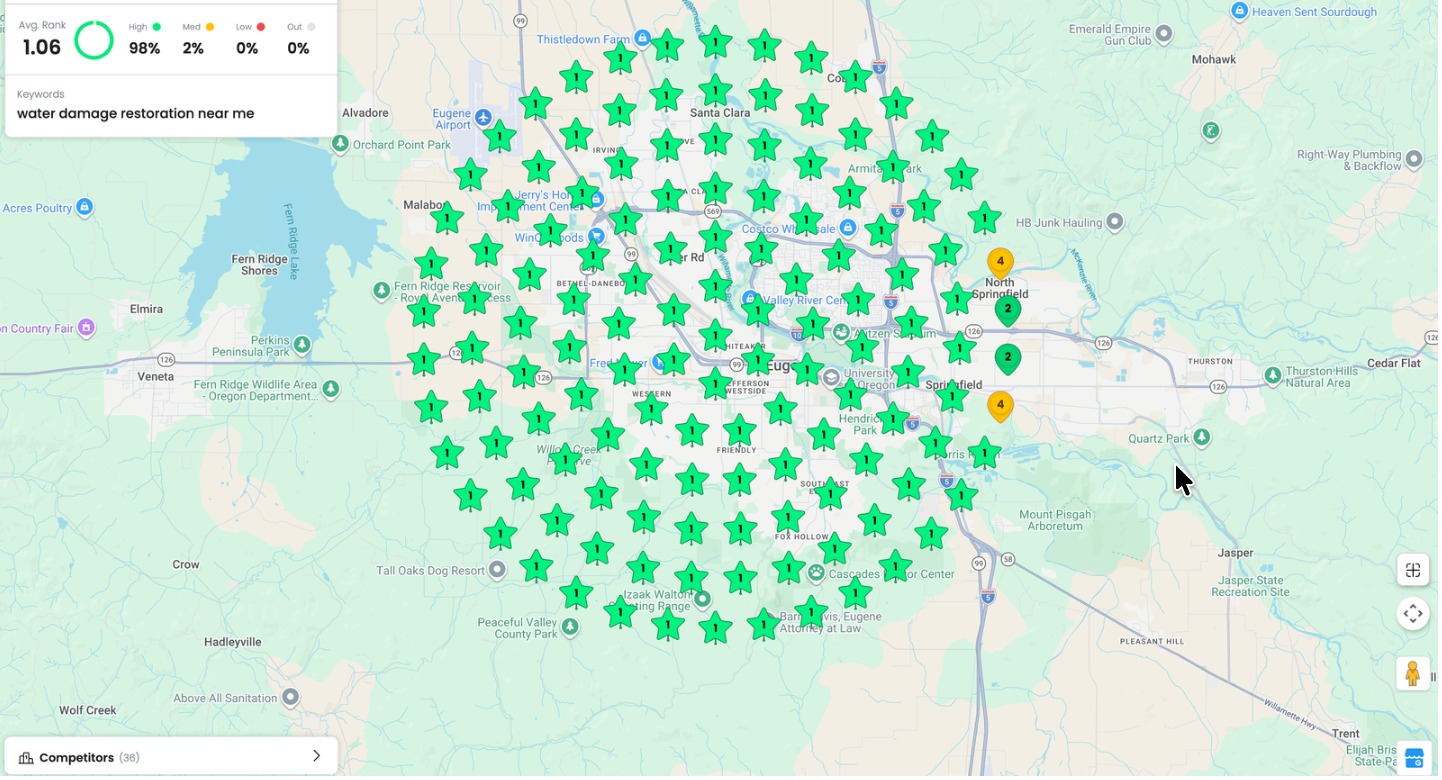
This report records average rank 1.06 for “water damage restoration near me,” with 98% High and 2% Medium. The visible grid is predominantly marked 1, with a small number of 2 and 4 markers.
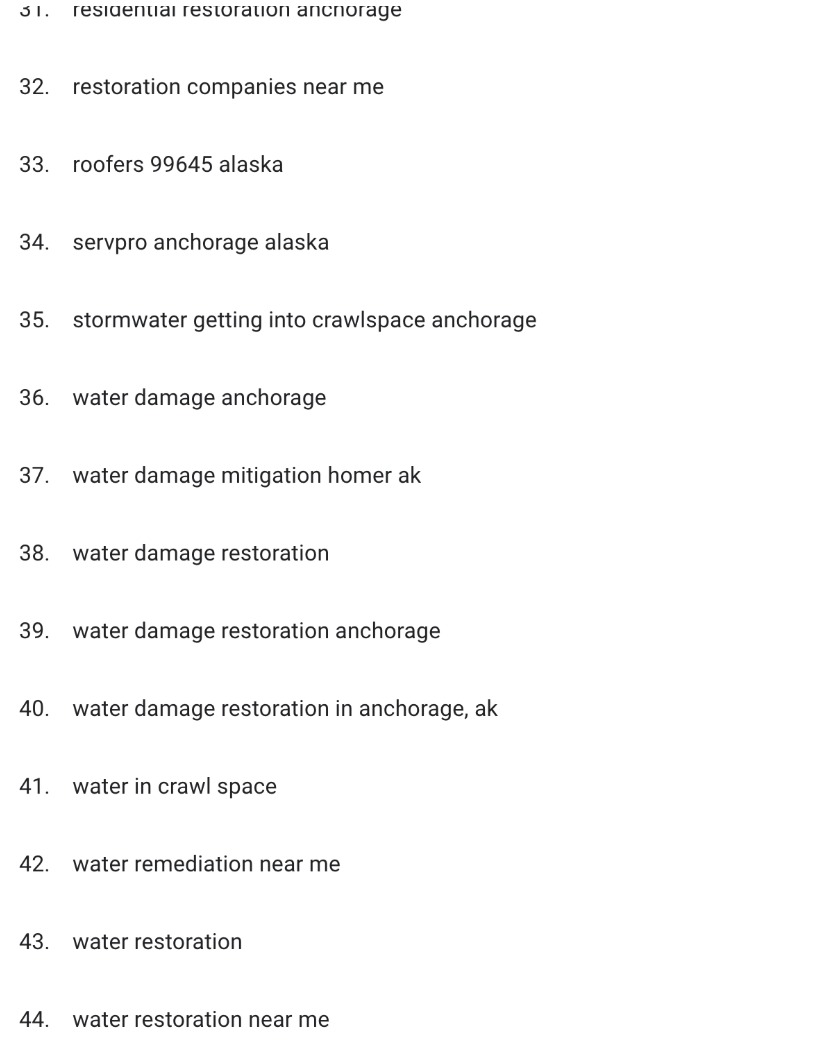
The supplied list shows restoration, water-damage and location-modified searches—including “water damage anchorage,” “water restoration near me” and “restoration companies near me.” It documents the query vocabulary being monitored.
Business Profile reports provide a clear record of interaction, call and website-click activity for the date windows shown—useful evidence for evaluating local search touchpoints.
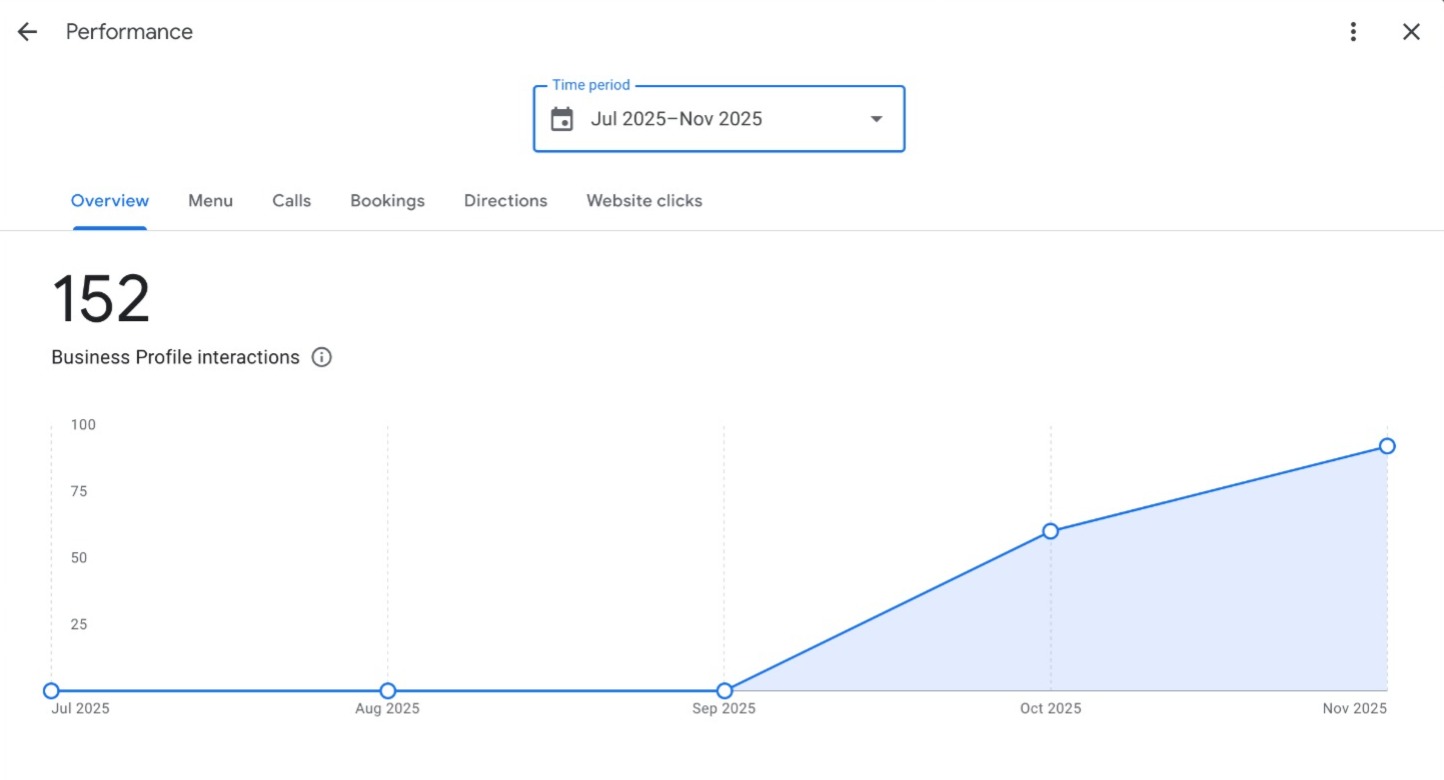
The overview displays 152 Business Profile interactions. The supplied line chart is flat through September, then shows plotted increases in October and November within this reporting period.
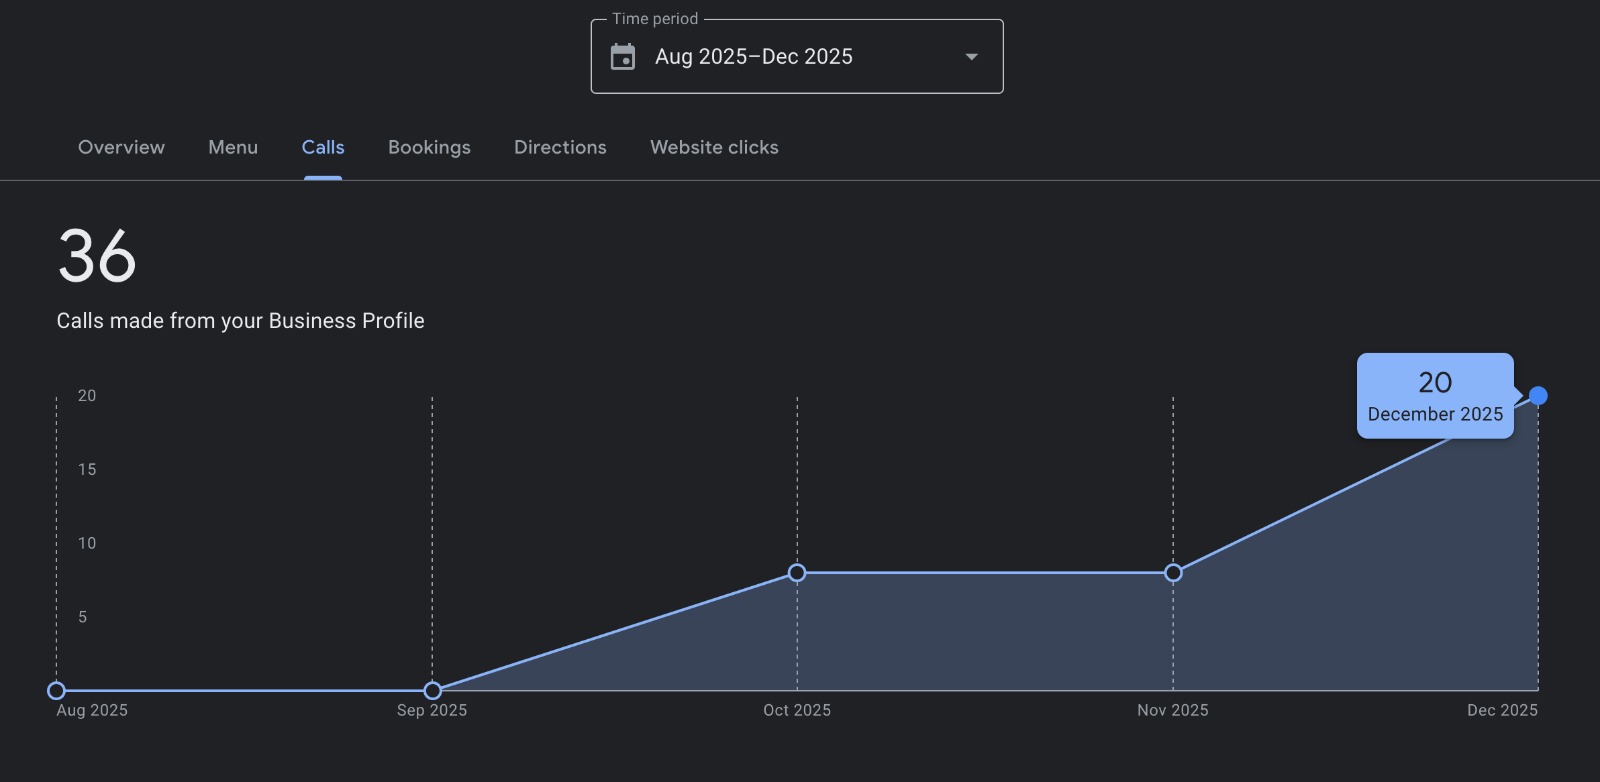
The calls report states 36 calls made from the Business Profile for the selected period. Its December data point is labelled 20, following zero values in August and September and displayed October–November points of 8.
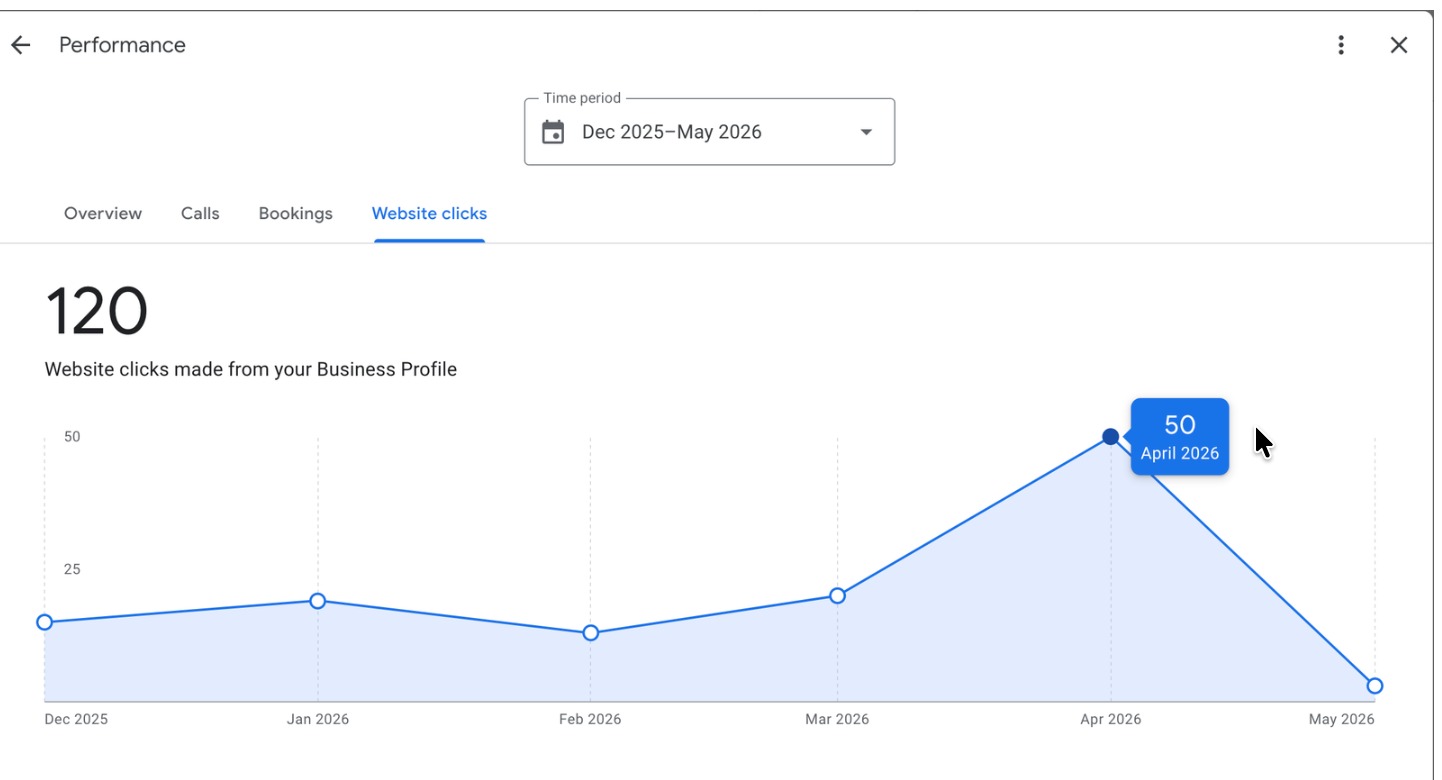
The report shows 120 website clicks made from the Business Profile. The visible April point is labelled 50, making that month the highest plotted value in this specific screenshot.
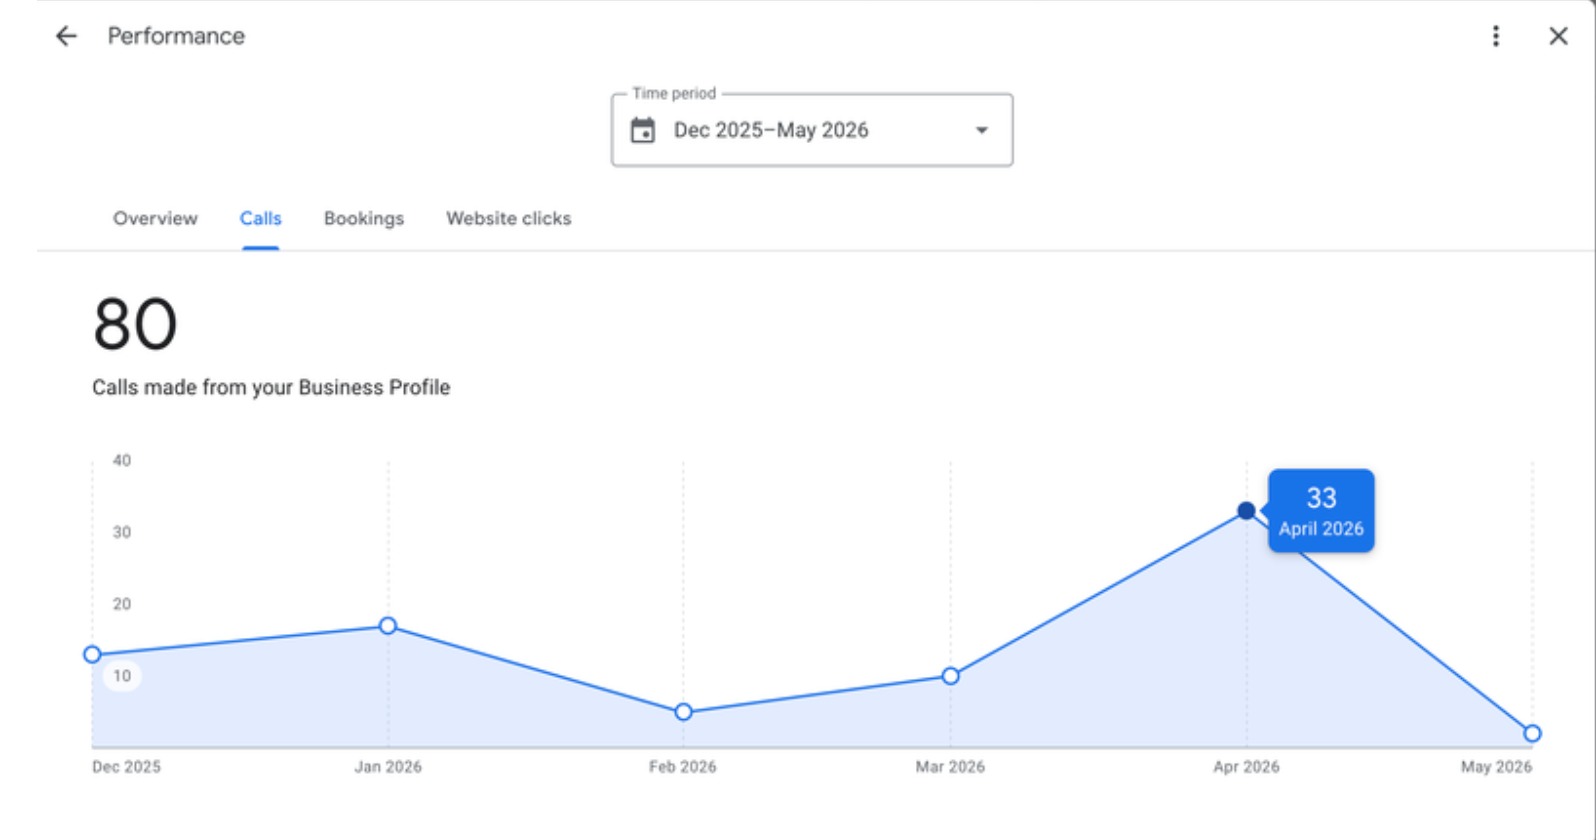
The screen records 80 calls made from the Business Profile during the selected period. The April point is labelled 33, the highest visible point on the chart.
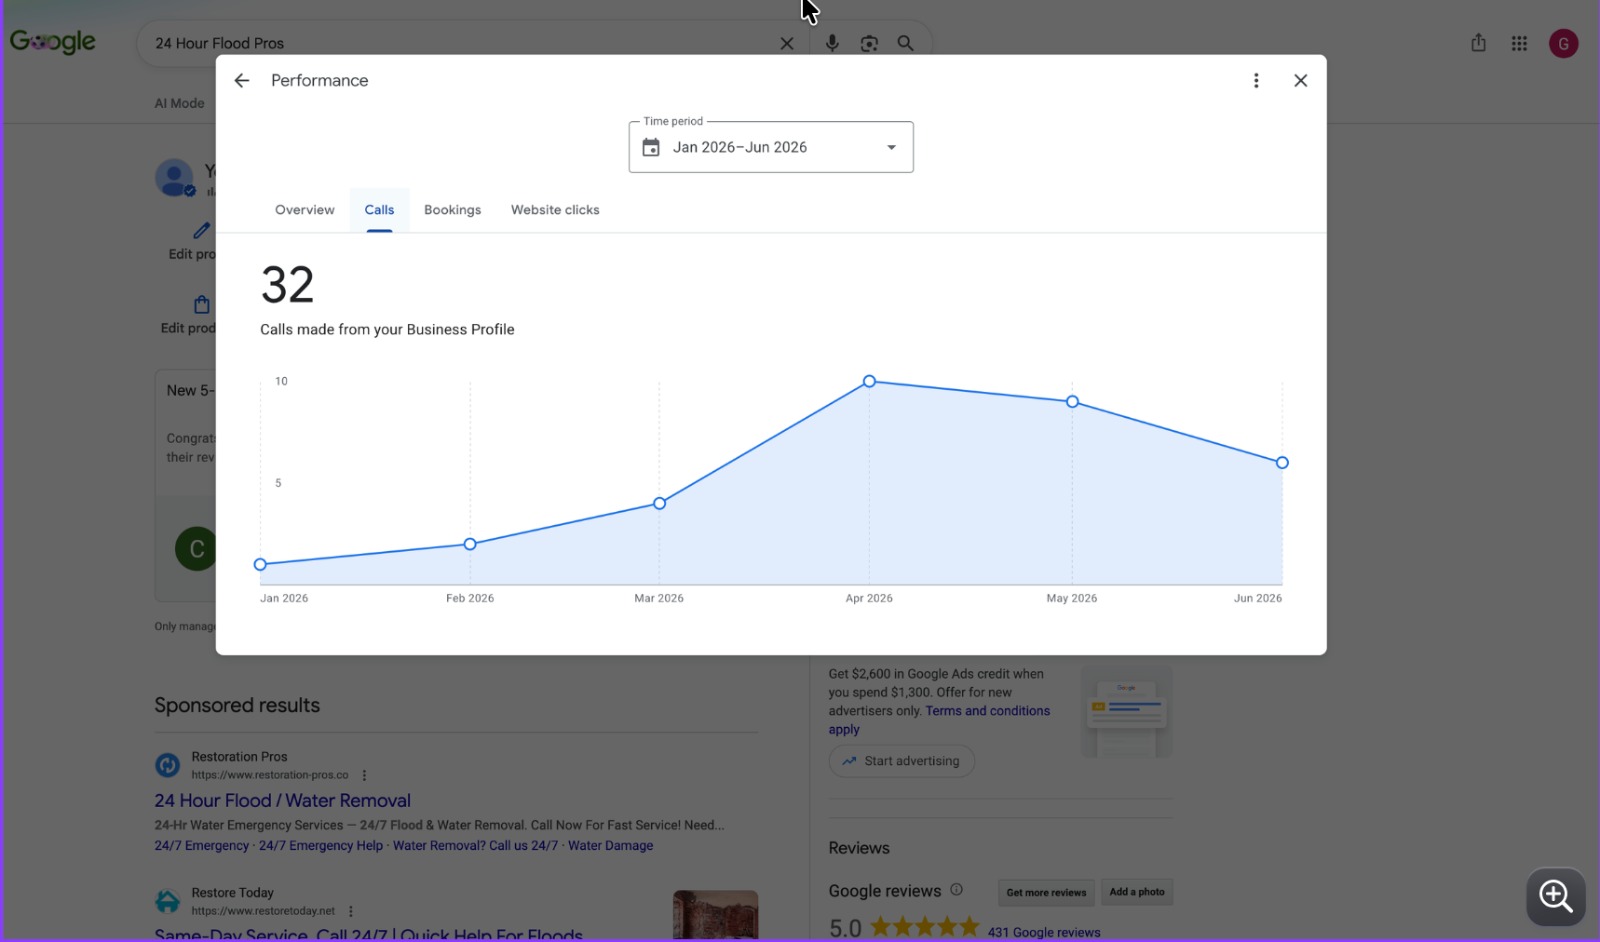
The January–June report shows 32 calls in total. Its chart reaches a visible high of 10 in April before showing 9 in May and 6 in June.
Evidence note: figures, labels, dates and ranking distributions above are transcribed from the supplied screenshots. They are presented as reporting snapshots; no unshown baseline, attribution or future outcome is implied.